The recent proposal from a group of high-profile editors to downplay or eliminate mention of the dastardly impact factor and replace this with other metrics, mainly a distribution chart of citations, raises some interesting issues. Phil Davis touched on a few of these earlier this week.
For example, does their proposed approach actually defy the impact factor or feed it? Does it perpetuate the tendency among academics to conflate journal impact with paper citations?
The group made its proposal in a paper published on the bioRxiv preprint server.
In the paper, the authors urge:
. . . journal editors and publishers that advertise or display JIFs [Journal Impact Factors] to publish their own distributions using the above method, ideally alongside statements of support for the view that JIFs have little value in the assessment of individuals or individual pieces of work
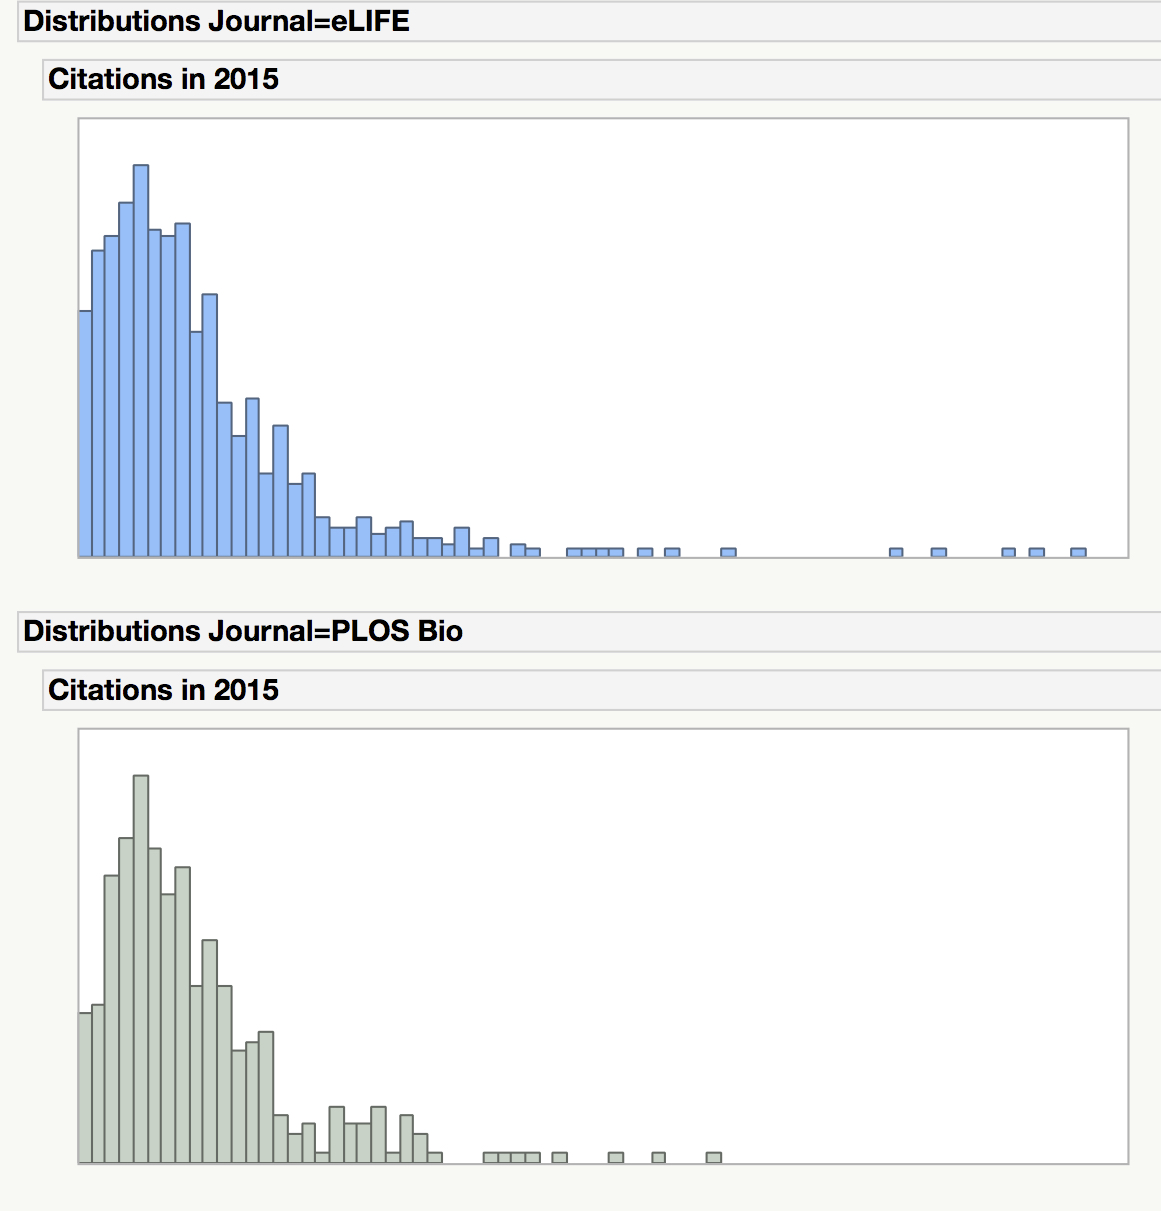
The putative goal of the proposal is to sweep the impact factor aside and replace it with more fine-grained measurements, notably a chart like those seen below (linked over from the Nature coverage) of a distribution of citations. These charts are very similar to those included in the pre-print paper.

Edward Tufte could use charts like those to the left as bad examples of data display and clarity, as they nicely illustrate that showing distributions can be misleading, as well.
For instance, the charts cover two years of citations, but the images make no differentiation between Year 1 and Year 2. Also, the y-axis isn’t set — the Nature y-axis ends at 80, while the Science y-axis ends at 70.
It gets worse. Look closely, and you’ll see the three graphs aren’t even in the same units. The PLoS ONE graph is stated in thousands of papers, so it is actually 175-times as high as the other two charts. But it doesn’t look like it. When you understand the scale, you can see that more than 12,000 PLoS ONE papers received zero citations, a noteworthy data point — but this is not something the chart really helps you see. In fact, the three charts look equivalent when given a quick visual scan, despite some huge differences.
Moving the y-axis like this is a common way to make pretty pages, but moving it also manipulates perceptions. Sometimes, this is purposeful, done to either create a false sense of urgency or a false sense of equivalence.
The x-axis fares a bit better — it’s at least stable across the set, perhaps because we don’t respond as much to left-right manipulation as we do to up-down manipulation. But problems remain. Does the PLoS ONE chart really need to go out that far? Moreover, what does “100+” mean? What’s the maximum number? Clearly, there are a lot of papers in the 100+ set in two cases (50-75, approximately), yet they are all represented as a wave of data against one rock labeled “100+”. And that”100+” area is a really interesting zone that drives a lot of action in the numbers. What’s the limitation on showing the entire distribution? What’s the optimal extent of the x-axis? Three hundred? One thousand? What would erase the righthand spike?
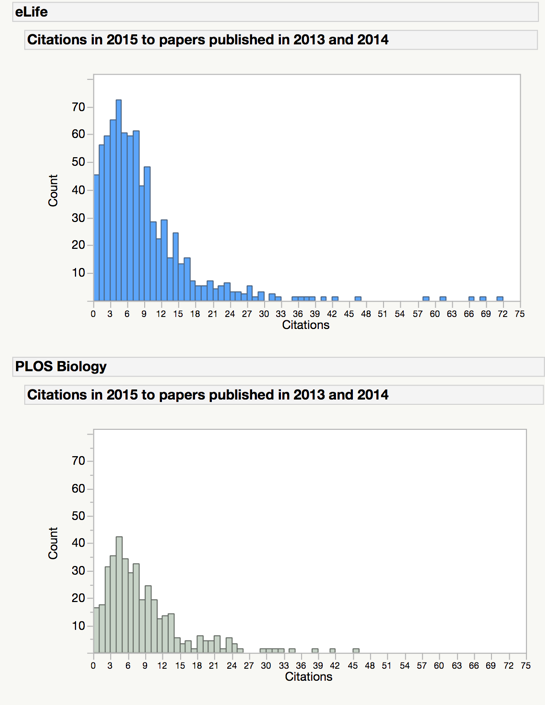
Given these and many other problems with the proposed graphs, it’s clear that showing a distribution is not a simple matter. In a post on this topic earlier this week, the charts suffered from a lack of labeled axes, making it hard to determine that the eLife y-axis was approximately three times as high as the PLoS Biology y-axis. You would have to carefully read the data presented alongside the charts to figure out that the two distributions are not equivalent. Given the power of visuals, the chance of creating a strong misperception is high. A revised version of the same charts (courtesy of Phil Davis) is presented below, showing how labeling axes and scaling data accordingly can change perception — that is, make them more accurate.
Imagine now that a hundred or thousand different editorial offices are left to their own graphical devices to generate these, and it’s easy to envision a baffling array of charts — different and irreconcilable colors, labels, axes, and legends. In fact, in a comment earlier this week, an author on the aforementioned paper encouraged users to “re-plot the data in new and interesting ways.” I would rather encourage people to plot the data in uniform and accurate ways.
The Nature charts also reproduce the impact factor itself (to one decimal point, a potential issue on its own), reinforcing this dreaded measure as the mean of the citations and as a familiar number authors use because it remains a main currency of publication.
Finally, taking the PLoS ONE example (while eliminating the scale of the y-axis), then thinking about it. Most journal citation distributions will look like this — because of common skew and generally low impact factors across the industry, as compared to behemoths like Science and Nature — suggesting that the hopes for helpful distributions will be frustrated or short-lived. If you were to look at 100 of these distributions, 90%+ would likely look like the bottom one from the Nature set of examples, and how interesting is that?
Because these profiles tend to be rather predictable — a lot of papers below the impact factor, some above, and a couple of huge outliers that really drive the score for high-impact journals — their utility is rather limited.
More importantly, I believe the authors of the paper in question seriously misread human psychology.
Let’s play this out.
I’m an author. I have a great paper. I want to advance my career. I look at the impact factor. Looks good. I also look at the citation distribution. I see that many papers underachieve — that is, their count of citations is lower than the overall impact factor for the journal.
Is that going to dissuade me?
Hardly. Most authors, their toils coming to fruition, enter the mythical land of Lake Wobegon, which means their paper is now decidedly above average. Each author submitting to a high-end journal is likely willing to think that her or his paper will end up in the tower at the right.
Showing a distribution is unlikely to shift the psychology of authors or tenure committees. In fact, a hard number, even to three decimal places, is much less prone to distortion than a distribution, which can be squeezed, resized, and subtly given false-equivalency with other distributions.
Getting the data for these distributions would add work and expense to a system already dealing with the workload and complexity of supporting a lot of steps and processes. It would also mean paying to get data from commercial entities that have assembled and curated these data — namely, the recently transacted Thomson-Reuters, and Elsevier (Scopus). Small journals may not have the means to produce these charts, so this proposal could reinforce industry consolidation and commercial interests. These are not “bad” per se, but these likely represent unintended consequences.
Overall, this proposal isn’t very strong. It seems to have key hidden downsides, is unlikely to have the intended effect, and could be expensive/difficult to implement.
But with this many big names on it, and because the topic is always a hot one, the paper will probably be cited a lot.

Discussion
30 Thoughts on "Optical Illusions — Shifting to Citation Distributions Only Makes It Easier to Fool the Eye"
I’m not sure the distribution is going to be personally useful to me.
However, I think you’ve somewhat missed the point in focusing on the labelling of the y-axes. As I read it, we are talking about distributions, which are about the spread of populations of data. In that respect the actual numbers don’t really matter, as it is the relative size of the different parts of the distribution to each other that matter. It would therefore be perfectly possible to render all of the y-axes to a percentage of the overall distribution. The only additional piece of information that the raw numbers is giving us is a rough eye-ball measure of the confidence in the distribution and that it is not a statistical quirk resulting from a small sample size (for a journal that publishes relatively few papers).
So the Phil Davis ‘revised’ histogram data actually adds nothing. It would appear the original is scaled to normalise the data (or at least that is the intention) which is a perfectly reasonable thing to do with a statistical distribution. By rescaling it to use absolute numbers on the y-axes this actually obfuscates the information somewhat.
It is the same with the Nature examples, it doesn’t really matter that PLOS One is in the thousands and Nature is not, because it is about the relative size of the distribution/population.
One place where the y-axes discussions could be useful, is perhaps extending what your article is saying, and what I am arguing, is to somehow generate a “confidence” measure, which would be based on the distribution and the population size. (It would need a much cleverer statistical mind than mine though!) This would generate a statistic which gives some measure of the confidence that the summary numbers are “true” given the skew and the sample size.
The resized histograms show me immediately that one journal is smaller than the other, while drawing to a percentage requires me to parse and project the difference in scale. Tufte and others have shown again and again that a small change in scale can create a large change in perception. It becomes more misleading when the scales are multiple and unpredictable. There is a known range (max-min) to journal size and citation counts in any field (with PLoS ONE a well-known outlier). Displaying these counts on uniform scales actually adds visual information — displaying them on variable scales removes or hides visual information.
If you’re going to use visual communication techniques, you should add as much information as possible, including scale.
X-axis scale corresponds to impact factor, y-axis scale corresponds to journal size. Maybe there is something interesting to be found by dividing by those two numbers and comparing distributions (are the curves relatively universal if you scale that way?) but the proposal we’ve seen so far doesn’t directly suggest that. I think the main point of this is to pull away from the Thompson-Reuters monopoly on the number; you can look at a lot more detail if you have the underlying data rather just the summary number. One thing that I think is more interesting is the time factor – for example how long a tail does the citation distribution for a given journal have – plot average citations per paper vs number of months since publication, what do those curves look like across different journals?
X-axis is indicative of the numerator in the impact factor calculation, y-axis is indicative of the denominator. The impact factor is the ratio of these two. So, yes, dividing these two numbers is interesting — it’s the impact factor.
I think most researchers don’t want to or feel they need to spend the time examining the minutiae of impact calculations. The point of my critique is that giving them graphs can be even more misleading in some cases than a ratio like the impact factor, which is at least a uniform approach to generating comparables.
I see zero citations in Nature and Science and none in Plos One.
Then you are having trouble parsing these histograms. There are more than 12,000 articles with zero citation in PLoS ONE.
Depending on the end goal (i.e., publishers retaining control of the data or the data being presented consistently), one solution would be for the new owners of JCR to produce these frequency graphs for journals in that database.
Thank you for the useful comments on data visualization.
However, the key issue that both this and Phil Davis’s posts seem to miss is that the main aim of the publication of citation distributions by journals is not to enhance interjournal comparisons, but to clearly visualize to even the most casual observer that the JIF does not predict citations to individual papers, and it is therefore misleading if applied to research assessment of individuals.
As an editor, I would of course agree that making it into a very selective journal means something and in fact gives an indication of performance, but certainly not a reliable quantitative measure, let alone to three decimal places.
We need to avoid delegating research assessment wholesale to journal editors.
Do we ‘seriously misread human psychology’. Maybe – but human psychology is just one component – it is the research assessment system that needs to change. Funders and institutions can make a start by encouraging measures such as encouraging biosketches and asking for a shortlist of an applicant’s most impactful paper. At the end of the day, those engaged in research assessment will have to actually read papers (or talk to people who can interpret the relevant research papers). This will not happen without incentives. It is quite simple really: research assessment has to assess how good researchers are themselves as referees and committee members.
Finally, an important point on nomenclature: preprints are ‘posts’ or ‘manuscripts’, not ‘papers’. I think it is important to clearly demark peer reviewed (paper) from non-peer reviewed (manuscript).
It’s worth noting that the aim of the impact factor (Journal Impact Factor, or JIF) was to provide a journal assessment tool. It has since been distorted to become many other things. So while the intent of the proposal might be not to enhance interjournal comparisons, at the same time the graphics promulgated by the manuscript and reproduced and extended in coverage show that interjournal comparison happens naturally.
I agree that broader research assessment practices should be embraced, but without time and funding to develop and administer these — and in an environment with depleted funding and increased competition — it’s clear to me that there are root causes to taking shortcuts, and we need to address those (i.e., increase funding, and take research assessment more seriously — it’s happening here and there, but the overall situation encourages shortcuts).
However, the key issue that both this and Phil Davis’s posts seem to miss is that the main aim of the publication of citation distributions by journals is not to enhance interjournal comparisons, but to clearly visualize to even the most casual observer that the JIF does not predict citations to individual papers, and it is therefore misleading if applied to research assessment of individuals.
I would ask the question of whether this is a widespread problem. Given that most people interacting with the Impact Factor are intelligent members of the research community or experienced administrators, is there really a common belief that the Impact Factor represents the number of citations for every single paper in a journal? I’ve never heard anyone state this, and I would think that anyone with even the slightest understanding of the IF would not be under this impression.
To be clear, I agree with you that moving away from simplistic numerical rankings and more toward the acceptance of subjective interpretation of work by experts is vastly preferable. I think perhaps there’s a bias against the use of opinions and qualitative judgments, even though they may be the most appropriate methodology when asking for opinions about quality.
I have done dozens (many dozens) of these histograms as part of presenting JIF to publishers, societies and editorial boards.
There are three major variations that are of interest:
1. Comparing the distributions for items that are 1-year post-publication versus 2-years post publication – as noted by Kent.
2. Comparing the distributions by section-heading as in “commentary” versus “original research” versus “News & Views”. Or, for journals that have very particular sub-headings indicating the topic of the research – these can show some fascinating differences in citation count, time-to-citation, and highly-cited or uncited work.
3. Comparing the distribution for “citable” versus “non-citable” items. So that the histogram shows the contribution of cited in the numerator-but-not-counted-in-the-denominator, versus counted-in-the-denominator-but-not-cited-in-the-numerator. This is perhaps the most interesting. High JIF titles tend to show significant citation to their “non-citable” content (see http://jama.jamanetwork.com/article.aspx?articleid=184527 – data table).
Distributions are more specific, granular information – they are no more (or less) perfect a representation of a journal’s performance; nor are they more (or less) perfect a representation of the potential citation of any particular article.
I find it quite strange to see Marie McVeigh’s active and passionate participation in this conversation, especially when she failed to address some tough questions at Retraction Watch in 2015, referring the readership instead to Thomson Reuters (see comments section):
http://retractionwatch.com/2015/02/09/refreshing-honesty-journal-asks-authors-help-game-impact-factor/
It is my understanding that Marie McVeigh left JCR in 2014 to go work at Research Square to implement the JournalGuide product. Perhaps Marie McVeigh could offer some explanation about this selective interest in the impact factor, and perhaps indicate who her current employer is.
Many people are interested in JIF and JCR. Many who read this blog are interested in JIF and JCR. And many who read this blog are not interested in JCR at all.
What I write here is my personal opinion and in no way should be considered to represent Thomson Reuters position or policies, nor that of my current employer.
Isn’t the simplest measure to assist in the interpretation of a skewed distribution the median?
The median, alone, tells you no more than the mean, alone. (And, the JIF is neither median nor mean).
Median is less liable to skew by very highly cited outliers – but neither gives you any idea of the shape of the distribution. And, I think the shape and span, as indications of the heterogeneity of the population is what Curry et al were most promoting.
There is somewhat more information when both mean and median are given together – especially for distributions that are “typical” in citation counts. Where a mean that is much higher than the median suggests a few highly cited papers against a background of “all the rest.” But we know that’s the case already.
The breadth and diversity of the citations for any given journal is the first problem.
The second problem, which Kent emphasizes here, is that comparison between journals where the range of size and citedness are vast, is extremely difficult.
Median can’t address that. Nor mean. Neither can/did/does JIF.
If we agree that the distribution is skewed then presenting a mean alone is surely worse than a median alone? JIF is strictly a ratio, but in the cases of zero non-citable items it’s a mean, but why split hairs.
More about the citation game:
http://www.nature.com/nature/journal/v510/n7506/full/510470a.html
http://www.asmscience.org/content/book/10.1128/9781555817442.chap42
http://www.tandfonline.com/doi/abs/10.1080/08989621.2015.1127763?journalCode=gacr20#.V5FjlXYrK00
It is obvious that the citation became a scholarly game that does not necessarily help advance the field in any constructive way.
What abut using median value to replace impact factor? This gives an estimate of the 50 percentile paper. Journals that publishes few reviews will see a significant decline in median value.
Reviews are much more helpful than hundreds of so called “research papers”.
The problem is not in the type of papers but in the principle of using biased metrics, such as the impact factor.
There is a deluge of so called “research papers” but without real outcome.
Take any journal, including the “top” ones and look at their archives during many years, you will not find any useful outcome of most of the published papers, but just description of measures and data reported. Most research papers’ data look like saying “green is green”, “bird fly” and “sky is blue”, “sun rises in the east and set down in the west”!
Worse, most research papers are false:
http://journals.plos.org/plosmedicine/article?id=10.1371/journal.pmed.0020124
By contrast, Reviews are important to critically analyze what is already published and suggest new research directions that could be more helpful than the salami research papers.
Scientific knowledge does not need metrics. The industrial revolution has started without any obsession to metrics of any kind.
Please note that the Ioannidis paper you cite is not a research paper. It contains no data, and is properly described as being “purely based on conjecture and simulation.”
There is significant evidence available to show that its conclusions are, at the very least, overstated. Please see:
http://arxiv.org/abs/1301.3718
None of the papers you cite are research papers, either.
Did the authors you cite analyze all the published papers or replicate their results and found that all the findings were true? Obviously not.
Again, the problem is not the article type but in biased metrics. So, the question about the validity and suitability of these metrics is, and will remain, open and debatable.
Actually, one of the articles I cited is a research paper. If you want to know more about the methodologies used in the studies, please read them.
All this is still dancing on the head of a pin. For example, both the original JIFs and the distribution plots under discussion here, are still anchored in the two-year citation ‘window’. The justification? The term ‘impact’ is simply unconvincing for papers cited within this relatively brief interval. Mean citation ‘delay’ is going up in a number of journals, perhaps because of ever-greater access to the older literature through digitising and open access. JIF as a Flash-in-the-Pan index, perhaps? Certainly some of short-term highly-cited work will turn out – in the longer run – to have had impact in the way most understand the word, but only some of it. It remains a disgrace that the data distributions, so well revealed in the citation distribution plots above, could ever have been ‘reported’ by their mean value in supposedly numerate sciences: this ‘metric’ would be laughed out by referees if ‘offered’ in the methods sections of the very papers behind the distributions. JIF is not any sort of ‘metric’: it is way beyond the tinkering, or even the root-and-branch ‘correction’ stage. We should spend energy on finding a fundamentally different approach rather than pondering life support for any aspect of this wannabe ‘metric’.
While I agree with much of what you say, one of the problems that the IF solves (poorly) is that it provides a fairly fast way of measuring (poorly) impact. Researchers need rapid feedback to advance their careers. A paper may slowly accumulate citations over a decade, but no one wants to sit around for 10 additional years as a postdoc to wait until that point to hit the job market and move on to a PI position. It’s unlikely that a researcher could last 10 years waiting for funding to finally come through as citations slowly trickled in.
So any new solution needs to be either predictive or in some ways limited to a short enough time span so as to be useful.
Amazing! You seem linking career advancement to biased metrics!
Instead of dissociating any link between career and biased metrics, your comment suggests that researchers should behave unethically to get promoted, funds and recognition!
Associating career to biased metrics looks like to say, hey guys, if you want to get funded, promoted or recognized, try to scam and cheat to get the maximum of citations and JIF values, no matter how these metrics are biased!
Regardless, if you have potentially interesting ideas to test, why do you need a citation record or JIF values to get fund and attempt them? What citation numbers or JIF does change to potentially interesting projects or ideas to be tested?
If you wish to get job, why should you have thousands citations? Don’t you deserve a job without citation?
People outside academia get jobs without being necessarily “cited”, why in academia researchers should get cited to get career promotion or jobs?
Most of the problems in academia and scholarly publishing are due to biased metrics such as JIF and citation. But maybe also because researchers and policymakers in academia are sometimes/often shortsighted people. This should change toward more objectivity and equity. All people should have jobs and career promotion.
Even animals can perform the hardiest tasks when they are trained to. Do you think that people are unable to do so without necessarily having citations or JIF? Jobs and career advancement should be right to all people but not a ‘luxury’ linked only to biased metrics.
Wow, that’s reading an enormous amount into my comment that wasn’t there.
I am not advocating the use of any metric, merely pointing out how things are done at present.
There are limited numbers of jobs and limited amounts of funding. Giving “everyone” a research job and research funding is simply not possible. There must be some methodology for making those choices.
Do you really think that “there are limited numbers of jobs and limited amounts of funding”?
What about the countless “billionaires” and Panama papers issue? What do these issues suggest?
Isn’t there is a lot of money?
Why there is money for games on TV but not for research, academia or for the society in general?
What do the $ billions in banks do? Why money is not invested in research and to improve human life rather than to be stacked in banks or in empty real estates?
The problem is not in the availability of money but in its distribution and management, isn’t it?
There is a lot of money: the number of billionaires is increasing steadily over the world. Humanity has never been as wealthy as it is now.
I’m just going to slowly back away from this conversation. Have a good day.
JIF and Impact of research are are two different points and assessing a researcher or a research can’t be correlated with JIF. JIF is just the reflection of research output in broad spectrum. But in order decipher the quality of research and a researcher associated with it can only be drawn out once we get the complete insight of the work which lies in the raw data associated with the publication. Then this descriptive insight can lead close to transparent and correct assessment. We all need to revisit the conception of Impact factor Vs Intellectual. Initiative have been taken place by F1000, Profeza e.t.c. As these data will not be only prevail transparency but will also reflect the accountability of individual author in an article.