I recently came across an article published last year in the journal Library Philosophy and Practice titled “Conventional Wisdom or Faulty Logic? The Recent Literature on Monograph Use and E-book Acquisition.” Written by Amy Fry of Bowling Green State University, the article critiques what Fry sees as an “inaccurate and misleading” invocation of the conventional wisdom on academic library book circulation by proponents of radical change to library collection-building practices. (I should probably disclose here that I am one of the villains Fry cites in the article.)
The particular piece of conventional wisdom at issue here is the idea that in academic libraries, roughly 40% of librarian-selected books circulate rarely or never, and that this fact represents an indictment of traditional collection-development practices. “A closer look at the literature,” Fry contends, “reveals that the data being cited to support this claim has been communicated, for the most part, in an inaccurate and misleading way by its proponents and that a great deal of data exists, in fact, to refute it.” Fry provides a review of recently-published arguments that draw to some degree on this common belief about circulation patterns in academic libraries, and then cites a list of studies that she believes disprove that belief.
Fascinatingly, however, the very data she provides end up supporting the conventional wisdom with an almost spooky exactness.
Let’s back up for a moment, though, and look at the source of the conventional wisdom. Where have so many people gotten the idea that 40% of the books in academic libraries rarely or never circulate?
The urtext for this belief is a 1979 book based on research conducted by Allen Kent et al. at the Hillman Library of the University of Pittsburgh. Variously referred to as the Kent Study, the Pittsburgh Study, or the Pitt Study, this research project famously found that 39.8% of that library’s books “had never circulated during the first six years on the library’s shelves,” and, furthermore, made a statistical argument that it was unlikely those uncirculated books would ever be checked out in the future.
The Kent Study is indeed cited frequently in the library literature on collection development, and Fry is right to note that it is often referenced by those promoting the substantial (or even complete) replacement of traditional collection development practices with patron- or demand-driven acquisition models. She is also correct in noting that the Kent Study represents data that is now several decades old, and that many other circulation studies have been conducted both before and since.
But does the data produced by those other studies refute the findings of the Kent Study? Based on the evidence she provides in her article, the answer seems to be no — quite the opposite. Let’s take a closer look.
Fry shares data from circulation studies conducted at 18 institutions or consortia: one regional consortium, four ARL libraries, and 13 smaller academic libraries. The data are summarized below. (For those following along, please note that her article misidentifies the University of Denver as an ARL library and Louisiana State as a non-ARL library; those errors are corrected in the summary below.):
Consortium/ARL Libraries
- 66% of the 1.3 million books purchased by libraries in the CARLI consortium between 2003 and 2008 circulated during those years. (This means that 34% did not circulate during that period.)
- 69% of books purchased on approval by Penn State Libraries circulated in the first three years after purchase. (Thus, 31% did not circulate.)
- 60% of books purchased on approval by UIUC Libraries circulated in the first three years after purchase. (40% did not circulate.)
- 62.5% of print books purchased by the Kent State University Libraries between July 2009 and December 2011 had circulated by December 2012. (37.5% did not circulate.)
- 45% of books cataloged at Louisiana State University between January 1 and August 31, 1991, had circulated by January 1992. (55% did not circulate.)
Non-ARL Libraries
- 58% of 2005 imprints owned by the University of Denver library had circulated by 2009. (42% did not circulate.)
- 45% of books purchased by Muhlenberg College in 1940-41 had circulated by September 1942. (55% did not circulate.)
- A 1994 study at the University of Illinois Chicago (UIC) Health Sciences Library found that 58% of books acquired between 1987 and 1989 had circulated by 1989. (42% did not circulate.)
- A random sample of roughly 1% of the collection of the University of Cape Town’s library found that 84% of them had circulated at least once. (16% had never circulated.)
- 84% of books acquired by the University of New Mexico Health Sciences Center Library in 1993 had circulated within 4 years. (16% had not circulated.)
- In 1993, an examination of four health sciences libraries found that 86%, 82%, 79%, and 62% of books published between 1980 and 1992 had circulated. (14%, 18%, 21%, and 38% of these books, respectively, had never circulated.)
- 40% of books acquired in September of 1995 by the library at Western Michigan University circulated within five months; 54% of books acquired in November 1994 circulated during the first sixteen months after acquisition. (60% and 46%, respectively, had not circulated.)
- A 2000 study at the UIC Health Sciences Library found that 81% of books acquired by that library in 1994-1995 had circulated within the first three years. (19% had not circulated.)
- 44% of books acquired by Lingnan University circulated during the first year after acquisition; 67% circulated during the first six years. (56% and 33%, respectively, did not circulate.)
- 37% of books acquired between 2003 and 2008 by the Asbury Theological Seminary in Kentucky had circulated by 2012. (63% had not circulated.)
- 30% of books acquired between 2003 and 2008 by the Asbury Theological Seminary in Florida had circulated by 2012. (70% had not circulated.)
Now obviously, this is a highly diverse data set; notice the variety of libraries involved (research libraries, college libraries, health sciences libraries, theological libraries, etc.), the different types of collections examined, the different amounts of time measured, etc. On the one hand, this suggests that we’re dealing with incommensurable data – how can you compare the implications of data showing how many books have ever circulated at Cape Town University with those of data showing how many books circulated between 2003 and 2008 at a theological seminary in Kentucky?
However, it’s the very diversity of these studies that makes their combined findings so remarkable. Despite the radical diversity of these data sets—so many different kinds of libraries measuring circulation of different numbers of books over different periods of time—both the mean and the median of the aggregated non-circulation findings match almost exactly the 39.8% figure found by the Kent Study:
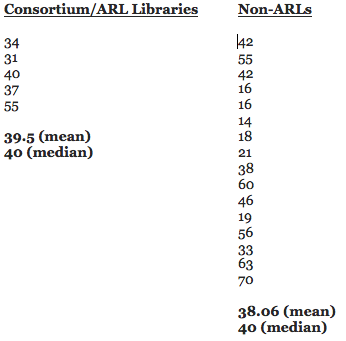
Here’s another interesting (and maybe alarming) fact: if you remove health sciences libraries — where circulation patterns might reasonably be expected to differ substantially from those in conventional academic libraries — from the data set, the data actually show substantially higher non-circulation rates than those found by the Kent Study: for non-medical, non-ARL academic libraries, the mean non-circulation value is 54.71% and the median is 56% — both roughly one-third higher than the non-circulation rate found in the Kent Study. (And, oddly enough, exactly the rate of non-circulation that Christopher Stewart describes — without providing adequate support for the assertion — as being typical of ARL libraries in a 2011 report.)
Now, it’s important to note that the diversity of these findings does matter in and of itself and has significant implications for particular libraries. Obviously, the fact that the mean and median values of this data set both tend to vindicate the Kent Study doesn’t mean that any individual library should automatically assume that 39.8% of its books aren’t being used. (And no one, to my knowledge, has ever argued that all academic libraries of every kind show the exact same pattern of circulation and non-circulation.) However, it is truly striking that when you tally the values of this very diverse data set, you find the Kent Study’s findings right smack in the middle of the distribution.
But all of this begs a more important question: what do these findings mean for your particular library? I would suggest that for any individual library, these general trend data should prompt local examination. A good internal question would be: “Given that the available data point to a mean/median of non-circulation among academic libraries of roughly 40%, what do the circulation data look like in my own library?” The answer to that question — and the attendant implications for collection development practices — will vary from situation to situation. But if you look at academic libraries in the aggregate, it appears that the Kent Study is being strongly vindicated.

Discussion
18 Thoughts on "Vindicated by Its Critics: The Kent Study in Light of Other Research on Library Circulation"
Interesting piece, Rick — thank you. One source of data that is very relevant to this topic is OCLC’s Sustainable Collection Services (GreenGlass). We recently signed on for this service to help us analyze and assess our print collection — both from the perspective of planning a weeding project and also as we begin to merge the collections of the library here at Berklee College of Music with that of the Boston Conservatory (a project we are undertaking in light of the recent merger of the two institutions). In addition to collection-specific data, GreenGlass gives access to aggregated collection data from all the libraries that have used the GreenGlass tool. Currently, this translates to 200 academic libraries representing 70 million holdings. The circulation rate indicated by this aggregated data interestingly aligns with the Kent Study — i.e. it shows that 42% of the aggregated collections show zero recorded uses, meaning that they have not circulated. As an aside, our own percentage of non-circulating materials here at the Berklee library is 37% — so slightly better than the average across all GreenGlass institutions but still within the ~40% ballpark.
Interesting, and begs the question whether the high utilization outliers are doing something different (University of Cape Town, NM Health Sciences).
Might you have a sense of how utilization of online access by library patrons of eBooks compare? My personal habits suggest it might be low. My library subscribes to quite a few, but the library indexing and search functions are clunky and I forget to take time to look. When I do, I usually find what I’m looking for or not and that’s it. When going to physical stacks to retrieve a title, a neighboring related book would often catch my eye. With eBooks, my serendipitous discovery rate seems lower. The publishers web sites are getting better at suggested related materials, but my library system that shows what I have actual access too doesn’t promote serendipitous discovery.
For online journal access, I would guess the unit closest to a book is an issue, For those journals with issues, I wonder what fraction gets accessed by library patrons? (actually, all journals have issues, but that’s a different issue).
This might be a good topic of a post, if it hasn’t been covered.
Cheers, Chris
Ebook usage is a really tough nut to crack. It’s usually possible to get more or less meaningful data on an institutional level, but in the aggregate there are just too many definitions of “use” out there to make cross-institutional studies very useful at this point. When you consider that many libraries get ebooks from as many as four or five different providers, each of which has a different definition of “use,” you see the problem.
Another confounding factor is the PDA/DDA model itself, which is predicated on the idea of providing access to far more books than are likely to be used. Since the unit cost of adding an ebook title to the pool of available options is vanishingly small (which is clearly not the case when it comes to physical books), the incentive is to add as many to that pool as you reasonably can. This naturally inflates the “uncirculated” numbers in a way that doesn’t actually reflect the usefulness of the program.
Many years ago, when I started my first post-PhD job, I became the liaison between my department (Mathematics) and the library. Being young and fresh faced, I took the job seriously and contacted the librarian responsible for mathematics. It turned out that the library was not getting any feedback from the faculty about books to order. The librarian was cleverly looking at data on what was being used and ordering more of that. Checking on the subjects, it was amazing how much the selections reflected the faculty from fifteen to twenty years ago. Over that period, the department had shed most of its algebraists and picked up a number of geometers. Since there was scant history of geometry on campus, there would be little data to point to “geometry”. No surprise, very few books on geometry were ordered.
With help from an insider, the librarian worked out a method to get feedback from the math faculty. As a result, the selection of books being ordered started suiting the faculty and grad students much better.
Rick, the 40% average/median you calculate is likely the result of coincidence and not some underlying phenomena, as you are comparing 16 non-ARL studies to just 5 ARL studies. Each of these studies, as you document, have very different definitions of collection and observation period, and you can see the result of this in the wide variation in results.
Many of these studies do a very bad job defining “book,” including materials that other libraries would classify as “serial.” If I remember correctly, the Kent study also included book donations (typically older books pulled from a retired professor’s bookshelf, or things the library wouldn’t have purchased in the first place), and government depository material (bounded committee reports) shelved in the basement.
What is strangely absent from the discussion, however, is what non-circulating material really means. The previous Cornell University Librarian used the Kent study as an argument for eliminating collection development librarians. However, a different University Librarian could have used it as evidence that her library was building a unique and diverse collection found nowhere else in the world, and use it attract humanities professors to Cornell. The executives at Barnes and Nobel would be shocked to find that 40% of books hang around their brick and mortar stores, only to be sold at deep discount on the sale table. A university librarian can take take this statistic and weave a more positive and attractive narrative.
Hi, Phil —
I’m not actually making any arguments based on a comparison of the non-ARLs to the ARLs, only showing those two categories of statistic separately because that’s how they were presented in the article under discussion. I agree that there aren’t enough ARL studies cited in that article to say for certain how typical those libraries’ data are for that class of library.
Seems to me that library circulation is like marketing. It is estimated that some 90% of marketing dollars are wasted but we don’t know which dollars are wasted prior to committing them.
If we knew prior to purchasing which books would be circulated we would not order those that are not.
To think the libraries have a better batting average (.344) than Ted Williams the greatest hitter of all time. I would say librarians are doing pretty good!
Are there comparable studies of e-book “circulation”?
See response to Chris Mebane above.
This is very interesting. Does ‘circulation’ mean that the book has been physically checked out of the library? If so, is any record ever made of which books need to be reshelved? These books obviously haven’t left the library, but have probably been consulted and presumably the relevant chapters photocopied. The percentage of books being used might be much higher if it included ‘in library’ consultation.
Yes, “circulation” refers to physical checkout of the book. Your question about in-house use is a good and important one, and does not have a very satisfactory answer — because while virtually all libraries keep track of circulation data, there’s much more variability when it comes to in-house use data. This is partly because not all in-house use can be tracked; even in libraries that (like mine, and most other research libraries) specifically ask patrons not to reshelve their books, many will do so anyway. And not all libraries keep track of the reshelvings that are done by staff.
However, in my library we do keep track of our reshelvings, and here the trend is dramatically downward (roughly in keeping with our circulation rates). I have a screenshot of our most recent trend line I can share with you, but I don’t think I can embed an image in a comment, so I’ll just tell you that in academic year 2001 we reshelved books 730,817 times; in AY2009 it was 271,367; in AY2015 it was 177,358.
Thanks Rick – that’s a very steep decline.
At one point in this post Rick seems to equate circulation with being used. But we all know that some books are used by patrons in the library but never checked out, so drawing conclusions about usage from the Kent study is a non sequitur. Tracking real usage rates would require studying reshelving practices within libraries. It’s also quite possible that books checked out never get really used. I’m sure we have all experienced checking a book out that we just didn’t have time to get to before the return due date. Finer grained studies are needed before any large conclusions are reached–or major decisions reached–about what “circulation” data really mean.
See my reply to Tim Vines, above.
Hi Sandy – I completely agree there are nuances around circulation data that should make us think long and hard about what the data is really telling us. It’s certainly not the whole picture, but it is, I would argue, a meaningful metric. I did also want to point out that the circulation data we loaded into the SCS/GreenGlass app referenced in my comment above included the “in-house” circulation stats from our ILS. Are those 100% accurate? No, because we only get to count a book as having circulated in-house if our patrons follow our instructions not to re-shelve the books when they use them without checking them out. And of course there is the question of what an in-house use even means? On the other hand, including those “uses” does mean that the circ data on which the 37% figure is based is not limited to materials that are checked out. I am not sure to what extent the other ~200 libraries that have utilized the SCS service have similarly included in-house circulation data — that would be interesting to know.
The fact that in so many different contexts and studies across so many different libraries the figure of approximately 40% keeps cropping up seems to me something that we should pay some attention to.
It would be interesting to see how these figures vary between libraries with/out PDA policies
The one thing I wonder about all this data is at some point there is a direct impact from ebook use on the use of print books. I did a cursory look at the print approval plan at the University of Akron for more recent year 2011-2014. The circulation rate was much lower than 60%. I think the drop is somewhat attributable to use of our ebook holdings. These holdings have dramatically increase via OhioLINK and our selectors in some areas going e-preferred.
The trend of increase use of ebooks for business and education were pretty dramatic during this time and the decline in print for those subjects was pretty noticeable. I am guilty of not thoroughly doing the analysis, because my purpose was not a deep dive in collections at that moment. I was looking from a budget manager perspective.
There are definitely two camps on this issue, but I think only current data looked at holistically will truly give us a good snapshot.
Good points, Kevin. But I think I’d quibble with “only current data.” If you want to get an idea of the possible impact of ebook use on print books in your collection, you should probably look at trends going back to before ebooks became a prominent part of the collection, and then see how the trend line changes as ebooks become more prevalent. It won’t be a perfect measure, of course, because there will be intervening variables for which you can’t control — but if you see a more or less steady downward trend in circulation that goes all the way back to, say, 1997, you can be pretty sure that it wasn’t caused by ebooks.