Editor’s Note: Today’s post is by Christos Petrou, founder and Chief Analyst at Scholarly Intelligence. Christos is a former analyst of the Web of Science Group at Clarivate Analytics and the Open Access portfolio at Springer Nature. A geneticist by training, he previously worked in agriculture and as a consultant for A.T. Kearney, and he holds an MBA from INSEAD.
In November of last year, I wrote about the anticipated market growth for journal articles in 2020. While many of the key findings of that article hold true, their size in some places was over- or under-estimated. While 2020 was indeed a record year for the growth of scholarly journals (8% Year on Year [YoY] paper growth vs a Compounded Annual Growth Rate [CAGR] of 3% in the previous six years), this growth falls short of my original expectations for a minimum growth of 17%.
I offer my apologies for presenting inaccurate analysis to the readers and editors of this blog. Here, I show the updated findings, explain the source of the inaccuracies, and discuss some of the challenges of using databases for market sizing.
Revisiting the findings
Once again, I use data from Dimensions and define the market as the journals in the ERA 2018 list, which was devised for national research evaluations in Australia, includes about 25,000 journals, and has a high overlap with the selective indexes of Clarivate’s Web of Science.
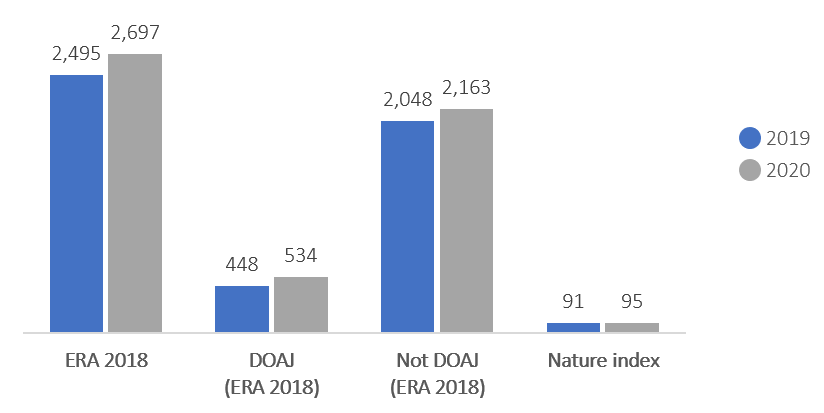
The market grew by 8.1% or ~200k papers in 2020. This is the strongest growth seen in recent years, three times larger than the average annual absolute growth from 2013 to 2019.
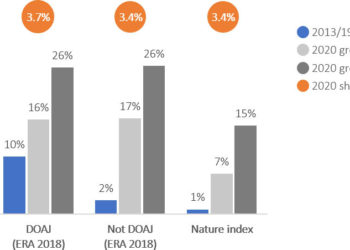
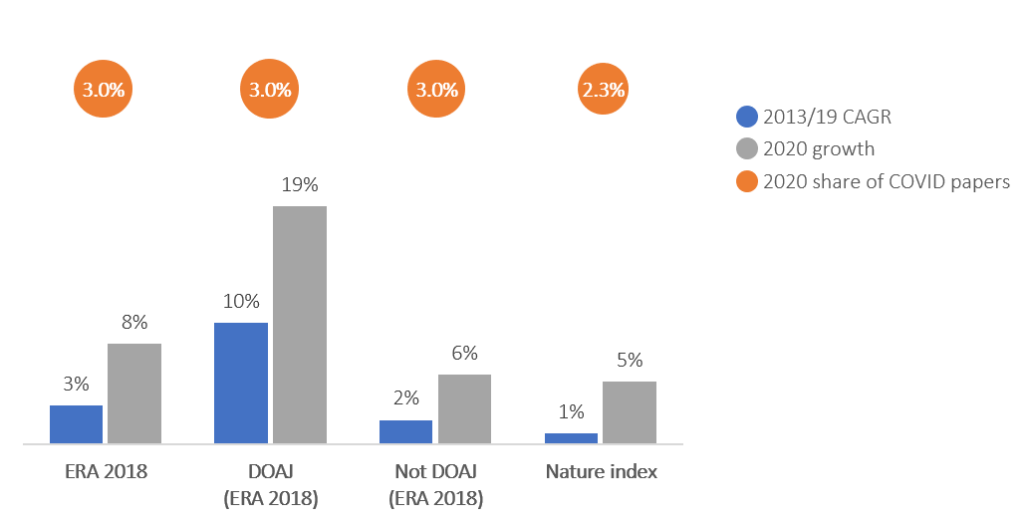
I previously suggested that the growth of fully Open Access (OA) journals was as strong as that of hybrid and subscription journals in 2020. That is inaccurate. As was the case in previous years, fully-OA journals grew more strongly in relative terms than hybrid and subscription journals. Specifically, the fully-OA journals in the ERA 2018 list grew remarkably well in 2020 at 19% YoY, compared with a CAGR of 10% in the previous years, and hybrid and subscription journals also beat historical performance (6% YoY vs 2% in previous years), but it fell short of my original estimate for a minimum growth of 17%.
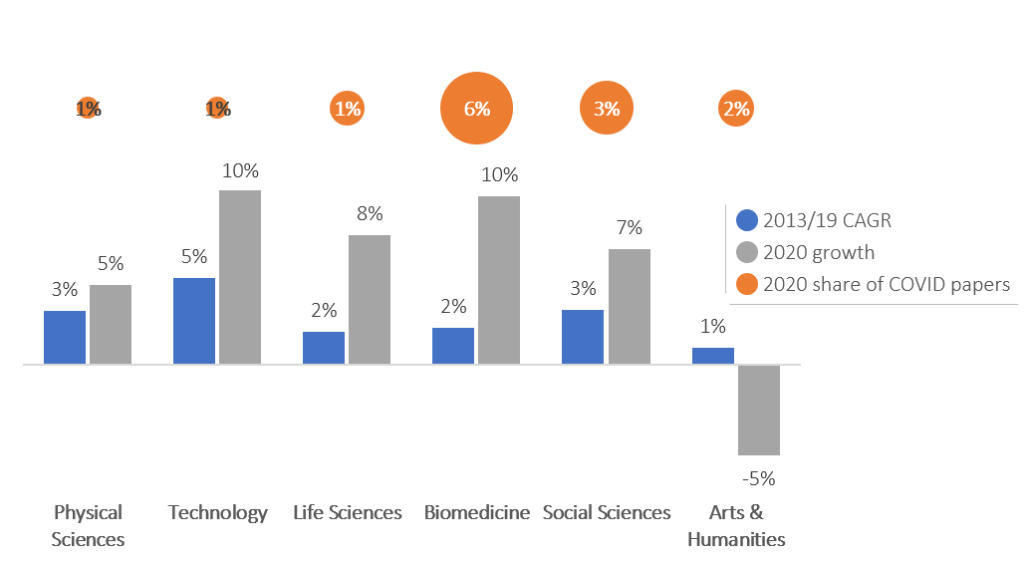
As noted in the previous analysis, most research areas appear to have beaten historical performance levels. Technology research built on its China-fueled, accelerated growth of recent years. Physical Sciences was in line with recent performance. Social Sciences and especially Biomedicine had a high share of COVID papers (defined as papers that mentioned COVID in their title or abstract) which drove their additional growth. Life Sciences grew strongly despite a relative absence of COVID papers.
Arts & Humanities stands out in the opposite direction: in 2020 it appears to have shrunk by 5% for its lowest paper output since 2014. I have not been able to confirm this finding on other databases, and it might be an artifact of using ERA 2018 journals, which omit some titles in Arts & Humanities. Yet, Dimensions implies minimal growth for this area even without the ERA 2018 filter.
The inflated growth in the previous post was hard to explain. Now, the re-estimated annual growth of 8% has a simpler explanation: COVID-related papers. Were it not for COVID-related papers, the growth in 2020 would have been just below 5%, making for a strong but unremarkable performance. In other words, researchers were on aggregate as prolific in 2020 as in ‘normal’ years and in addition they were able to churn a large volume of COVID-related papers.
What went wrong with the previous analysis
The simple explanation is that I did not understand well enough the article dating mechanism of Dimensions. When it came to filtering and standard analytics, Dimensions would re-date papers that were published online when they got assigned to a journal volume with a print date. This means that, for example, filtering for year ‘2020’ last November would include some articles that would eventually be re-dated to ‘2021’. Year ‘2020’ would appear inflated until all articles that were due for a print date had gotten one.
When I conducted the analysis, ‘2020’ figures were inflated and so was the ensuing analysis, especially for hybrid and subscription journals, where papers are likelier to have both an online date and a print date.
How to size the market (warning, it gets technical)
Dimensions has revised their article dating mechanism for filtering and standard analytics since December 2020. They are no longer prioritizing print dates, but instead they are trying to identify the date at which the version of record first became available (both dates are available for more sophisticated use cases). They have applied this retrospectively to all articles, and as a result, (a) a few million papers were re-dated backwards and (b) going forward, once a paper is assigned to a year, it is unlikely to be then re-dated to a future year.
Dimensions’ updated dating mechanism is a welcome improvement. It means that running article counts are unlikely to be inflated. For example, my previous analysis would have yielded different but reliable results from the very beginning.
Other databases have adopted different mechanisms to deal with online dates and print dates. Take, for example, the Web of Science (WoS). When conducting a basic or advanced date-based search, WoS assigns to both years those articles that have an online date and a print date in different years. Then the date filter on the results page prioritizes the online date and shows unique article counts.
Here it gets a bit more complex. Any journal that is transitioning from using only print dates to using both print dates and online dates (called ‘early access’ in this case) will show inflated paper counts on the WoS platform for the year of transition. If all journals of a publisher transition at the same time, then the paper output for the publisher will be inflated for the year of transition. And if a couple of large publishers transition at the same time, then the global paper output will appear inflated for the year of transition.
The inflation in the year of transition comes from the ‘early date’ articles: the transition year (t) benefits from ‘early date’ articles with a print date in the next year (t+1) without shedding articles with a print date in the transition year (t) and an ‘early access’ date in the previous year (t-1).
According to Phil Davis’ post, several journals and publishers (Springer Nature, Wiley, etc.) have been through this transition since 2017, but many others have not (Elsevier, OUP, CUP, etc.). Until this process is concluded for all publishers, market sizing on WoS will take some creative filtering to create the print-date view of the world and address the issue of inflation.