Due to errors in the analysis and some issues with how articles are dated, it has become clear that the numbers in this post are not accurate. Please see a new updated version of this post for a clearer picture of the change in publication levels during 2020.
Editor’s Note: Today’s post is by Christos Petrou, founder and Chief Analyst at Scholarly Intelligence. Christos is a former analyst of the Web of Science Group at Clarivate Analytics and the Open Access portfolio at Springer Nature. A geneticist by training, he previously worked in agriculture and as a consultant for A.T. Kearney, and he holds an MBA from INSEAD.
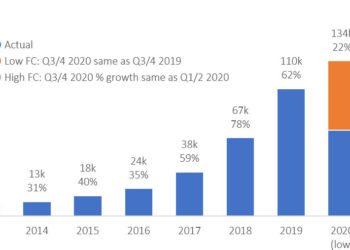
As 2020 nears its end, a counterintuitive picture is emerging for scientific output. Rather than suffering a COVID-driven slowdown, 2020 delivered extraordinary growth for journal content. To put it simply, journals are expected to grow by about 500k papers from 2019 to 2020, as much as they grew overall in the previous six years. Will a 2020 boom yield a 2021 bust?
Early reports of growth
I was inclined to look into the market’s performance after coming across reports of major publishers that claimed unprecedented volumes of journal submissions and published articles. For example, Springer Nature reported that articles grew by 11% in the first half of 2020. Elsevier reported 25% submissions growth for subscription journals in the first nine months of the year. And earlier in summer, Wiley reported 13% submissions growth for the fiscal year 2020, which half-overlaps with the calendar year 2020. While these publishers frequently beat the growth numbers seen for the market overall, they are not typically beating the growth numbers for submissions and articles by this much.
Assessing market performance with Dimensions
I used the free version of Dimensions to assess the market’s growth this year, and produced two forecasts in order to account for (a) the lag between publication and indexing on Dimensions and (b) the slowdown of publishing operations toward the end of December.
The conservative forecast (‘low’) assumes that Dimensions is fully up to date and publishing operations cease after the 20th of December. It implies that the observed volume of papers refers to 317 days and there are another 38 days of publishing left.
The aggressive forecast (‘high’) assumes that Dimensions is missing publications from the last two weeks and that publishing continues until the end of the year. It implies that the observed volume of papers refers to 303 days and there are another 63 days of publishing left. The end result should be somewhere between the two estimates.
All analysis is based on the ERA 2018 journal list, which was devised for national research evaluations in Australia, includes about 25,000 journals, and has a high overlap with the selective indexes of Clarivate’s Web of Science. It is not a perfect representation of the market, but it includes the vast majority of the content that matters the most, about 2.5m papers in 2019 per Dimensions. For the purposes of this analysis, the ERA 2018 journal list stands for the market.
COVID-fueled growth
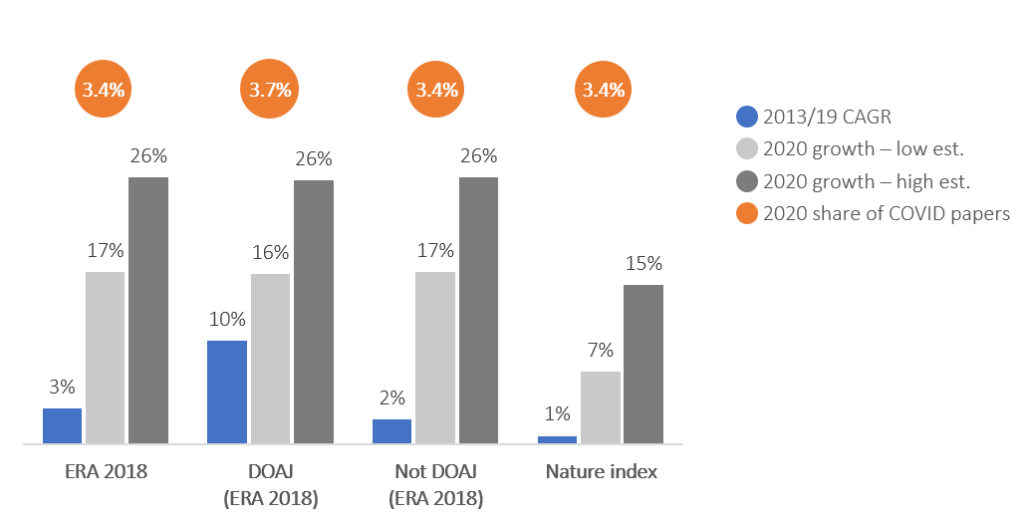
The market (ERA 2018) broadly did very well in 2020, growing between 17% to 26%, which compares with a modest CAGR (Compound Annual Growth Rate) of 3% in the period 2013 to 2019. This is a remarkable result, in line with the reports of major publishers, and it shows that COVID truly fueled scientific output in 2020.
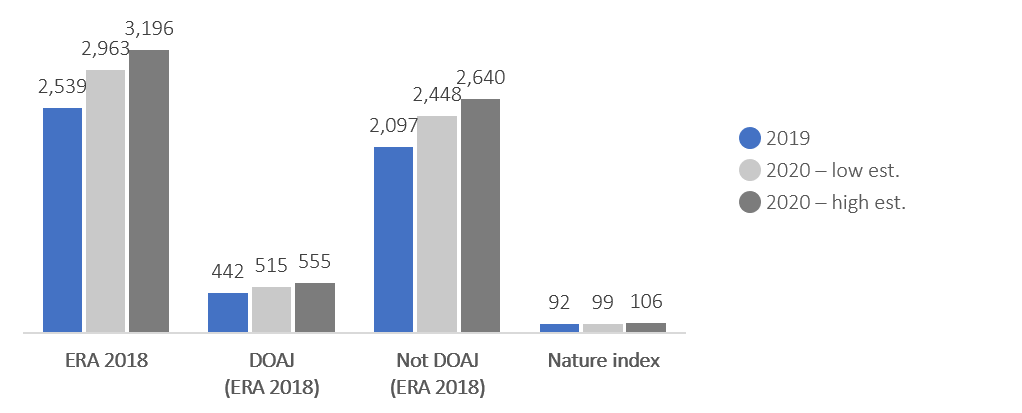
Contrary to previous years when fully Open Access (OA) journals outperformed hybrid and subscription journals (10% CAGR vs 2% CAGR for ERA 2018 journals), they performed similarly in 2020 and are expected to grow by up to 26%. This must have been welcome news both for fully-OA and subscription/hybrid publishers, although the latter may struggle to gain from the additional content given the budget crunch that many institutions are experiencing as a result of COVID.
Growth is also remarkable for selective journals, as the fairly steady Nature Index is expected to beat historical performance, growing by up to 15% in 2020 and exceeding 100k papers for the first time in recent years.
Further analysis shows that all research areas (apart from Arts & Humanities) achieved high growth, ranging from 15% for Life Sciences in the ‘low’ scenario to 31% for Technology in the ‘high’ scenario. As in previous years, the growth leader is Technology, and this year Biomedicine is claiming the second spot.
The notable exception is the area of Arts & Humanities, which appears to have been negatively affected by COVID. Upon further inspection, four of the five underlying areas (Studies in Creative Arts and Writing; Language, Communication and Culture; History and Archaeology; Philosophy and Religious Studies) may shrink, and only Law and Legal Studies is expected to grow. While I have no reason to question these results, there is a possibility that slow indexing or that publishing late in the year, somehow specifically affecting Arts & Humanities, generate misleading results.
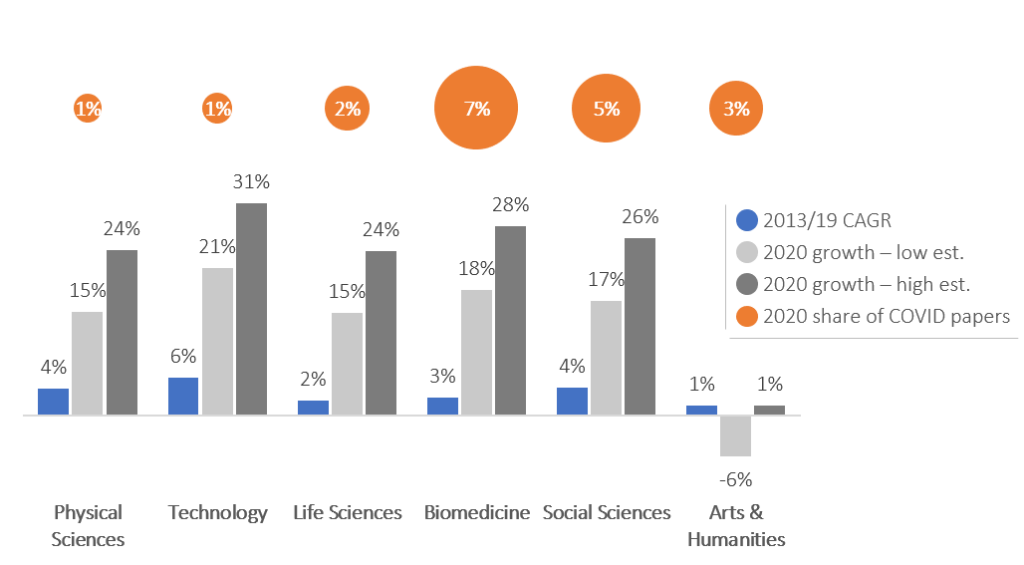
There have been about 90k COVID papers (papers that mention the word COVID in their text) in ERA 2018 journals so far in 2020. As expected, Biomedicine has benefited more than other areas from COVID-related papers, as 7% of its papers mention COVID. Nonetheless, COVID-related papers account for a fraction of this year’s growth for Biomedicine and the other research areas. In fact, Technology may achieve up to 31% growth, with COVID papers accounting for just about 1% of all papers.
The free version of Dimensions does not provide a regional breakdown, but there is indication that most regions have beaten expectations. This is based on an analysis of papers with popular surnames, which I call the Papadopoulos Index, the most common surname in my country of origin, Greece. Growth of papers that include the most popular surname of a country are broadly in line with the growth trajectory of the country itself.
What is the growth mechanism?
I have come across a few explanations for this year’s phenomenal growth. The obvious explanation, that growth has been driven by papers related to COVID, only explains a small fraction of the additional papers.
Another suggestion is that authors have been resubmitting old, rejected papers. While that may be partly true, the high growth of the very selective Nature Index implies that novel, impactful papers account for part of the growth.
Perhaps, while labs were shut and experimentation was put to a halt, researchers brought forward writing that was planned for a later date, akin to a ‘loan from the future’ that may lead to a dip in scientific output in 2021, or they rushed to publish unfinished research. The latter explanation came up in a Twitter exchange with Scholarly Kitchen Chef Lisa Janicke Hinchliffe. It would be similar to ‘salami slicing’, the practice of splitting up findings into multiple separate papers rather than concentrating them into one stronger publication.
Implications for publishers
While the mechanism of this year’s growth is unclear, it may have implications for the scientific output of 2021. If, for example, growth has been a loan from the future, 2021 is likely to be worse than 2020 and possibly in line with 2019. If the growth of 2020 has been driven by ‘salami slicing’, then 2021 might look like a ‘normal’ year for scientific output. Yet ‘normal’ does not mean using as a baseline the results of 2020 and adding some growth to it; instead, it means using 2019 as a baseline and adding two years of ‘normal’ growth to it.
It gets more complex. Contrary to previous years, this year’s growth was equally strong for fully-OA content as it was for subscription and hybrid content. As a result, it may be that the return to ‘normality’ will be more abrupt for subscription and hybrid than for fully-OA. A back-of-the-envelope calculation implies that a ‘normal’ 2021 output for fully-OA journals will be equal to the expected 2020 output. On the contrary, the ‘normal’ 2021 output for subscription and hybrid journals will be 14% lower than the expected 2020 output. Factor in also that in 2021, OA requirements for funded authors, such as those from Plan S, will go into effect.
Suffice to say that planning teams in publishing houses have a rather complex exercise on their hands. The counterintuitive, strong growth of 2020 can give a false sense of security, and lead to overly optimistic forecasts for 2021. Yet, the market may be running on fumes and face some turbulence in the next months before a return to normality. Publishers will need to be conservative in their planning, while also maintaining flexibility to address high paper volumes for as long as the strong performance continues.
Discussion
13 Thoughts on "Guest Post – Scientific output in the year of COVID — Please See Update"
Interesting analysis. It is possible to extract statistics from Crossref about all the publications which have DOIs. For example, the following API command will show the number of publications which were published between 2020-01-01 and 2020-10-31 and their publication types: “https://api.crossref.org/works?filter=from-pub-date:2020-01-01,until-pub-date:2020-10-31&facet=type-name:journal-article&rows=0”. I did some queries about the previous years to get data about the same periods of years (january-october), and I got the following results for the number of publications which are designated as “journal articles” in Crossref (and the growth compared to the previous year in parentheses):
2016: 2382088
2017: 2521390 (139302)
2018: 2710495 (189105)
2019: 2923410 (212915)
2020: 3160473 (237063)
According to this the annual growth increases somewhat, but the increase might be not as drastic as the Dimensions data suggests.
I also found that Dimensions makes no difference between different journal items, which means that practically all publications in journals are categorized as articles, including meeting abstracts and editorial materials, etc. This can further complicate the picture, because some of the journals indexed in Dimensions contains many such items: For example “Journal of clinical oncology” has more 7500 articles in 2019 according to Dimensions (https://app.dimensions.ai/analytics/publication/source_title/aggregated?and_facet_year=2019&and_facet_source_title=jour.1312191), but according to Web of Science almost 7000 of these are “meeting abstracts”.
Hi Gabor, I’m not a user of CrossRef data, but hearing that they index full publication dates will make me a convert. I think none of WoS, Scopus, and Dimensions have full date. Might be wrong though…
I don’t have access to WoS for my articles. If you look only at SCIE, how many articles and reviews do you get for say 2015, 2019 (full years), and 2020 (YTD)? If that’s of vs Dimensions, I’d also question the analysis.
Indeed Crossref does index full publication dates (sometimes even separate online and print dates), although as far as I know not all journals deposit full data (some of them only month or year). WoS has a field which is called “PD/publication date” and contains month and sometimes even day data. Of course Crossref has no such user-friendly interface as the other platforms, so it is a bit more tedious to access data.
WoS SCIE contains the following number of articles+reviews:
2015: 1421544
2016: 1475447
2017: 1528564
2018: 1607739
2019: 1784835
2020(YTD): 1596705
The publication date field is not searchable in the current WoS search interface, although I just checked the preview of the new WoS interface, and there is a field tag called “DOP” (publication date), and the full publication date is searchable in the advanced search.
Hi Gabor, thank you for querying WoS. The results from WoS point to lower growth than the reports of the publishers and the analysis on Dimensions. It might be that the data of WoS are not as up-to-date as those of Dimensions and/or that the growth has come from non-article, non-review paper types.
For good measure, I took a look on ScienceDirect. Presumably Elsevier would be depositing content there instantly? I queried with the term ‘abstract’ in Review Articles and Research Articles (https://www.sciencedirect.com/search?qs=abstract&sortBy=date&years=2020&lastSelectedFacet=articleTypes&articleTypes=FLA%2CREV). The collection grew by about 20k-30k papers for each of the last two years. This year so far the collection has grown by 90k papers, which would translate to 20% growth with a full month to go.
Well, we’ll just have to wait a few weeks to see how this plays out.
Hi Christos, you are right that WoS is usually slower in updating with the latest publications, compared to Dimensions or Scopus. We should probably wait even a few months in 2021 to be able to get more reliable data. Although I agree with you that it is quite probable that the growth in 2020 might be higher than in the previous years, and it is mainly driven by technology and medicine (including COVID research). It will be interesting to see the results when the 2020 data has settled.
Hi – very interesting analysis. Crossref has seen a steady growth in journal articles over the last few years of around 6-8% – we reported some aggregate stats at Crossref LIVE20 last week for different content types – https://docs.google.com/presentation/d/1sUxhTO1kSRTKDbfFm2ocwdwAuLWblEDPX4lcNBYs6qY/edit#slide=id.ga6834d69d8_0_0 – preprints have increased dramatically. Looking forward to 2021, we are expecting that many 2020 journal article submissions won’t be published until 2021 Publishers have made admirable efforts to get COVID related papers published quickly but this may mean longer publication times for other papers. In any case, there is a lot of uncertainty.
This is a very interesting post! I was looking at this recently for a blog post and I noticed that there does not seem to be any change in the rate of submissions to ArXiv over the covid period. One suggestion that someone suggested to me since that post was that the growth could partly be explained by unpublished preprints. So, the rate of production of preprints didn’t change, but the ones that hadn’t been submitted to journals became more-likely to be submitted. https://publisherad.medium.com/the-covid-surge-in-research-papers-explaining-the-gender-disparity-d6ed1a925507
Another interesting contribution, Christos. In other work I have done this year I speculated that the pandemic would not have any negative impact on publishing volumes in 2020 (despite widespread belief that this might be so) although I think there may be effects in 2021 or even 2022.
It was clear that the enormous amount of biomedical research stimulated by the pandemic and governments’ need for analysis and obviously vaccines would cause an increase in those areas. The fact that it is more general (excepting AH SS and that may be due to the slow publishing effects you mention) is a little bit more surprising. My response to those who thought the lockdowns worldwide would have a deleterious effect on submissions was to look at the ethnological environment in which scholarship occurs. The publication of a paper is only the tip of the iceberg of academic activities, the engine room being the conduct of research and the interaction with the literature. While on average authors are responsible for about one paper per annum (using fractional counting, since increasingly papers are co-authored and those rates are at an average of about 4-8 per paper varying by field) there will be much material in hand within research groups ranging from un-analysed results through to draft papers being circulated between collaborators. Even with the closure of some labs resulting in no new results being added to the pile, there will still be quite a number of results left to analyse and draft papers in hand. Closures mean that scholars have more time to devote to the processing of what they already have, giving the results you have seen.
The interruption to the in flow of results arising from lab closures is unlikely to appear until next year and probably be spread out over coming years too, although to a lesser degree.
You mention salami publishing twice. While it cannot be doubted that some investigators have divided up results to eek out materials over several papers, the historical ISI statistics do not seem to support this interpretation at the global level. Work I published with Mayur Amin (ASLIB Proc 54(1).149-157) shows that the productivity of the system as measured by unique papers per unique author fell between 1950 and 2000 from just over to just below 1.0 per annum. Perceptually many researchers see the increasing number of authorships accorded to their colleagues and believe that this is due to salami publishing whereas it is really a phenomenon of coauthorship growth. When this is combined with the overall growth in the number of researchers worldwide (the principal driver of paper and journal numbers) scholars believe they are being overwhelmed and conclude that everyone else is slicing stuff up. See also pp35-38 of the STM Report 2018 on this.
It would interesting to see a continuation of the graphs I refer to up to the present day. My instinct is that with the exception of a time when lab work is excluded (thereby increasing the hours available to process results) most researchers have reached a peak of productivity of one paper per annum (using fractional counting of co-authorships), so that the ratio of papers to each unique authors is a constant when looked at worldwide (although of course counting papers and indeed authors is far from straightforward globally).
Hi Michael, thank you for reading and for sharing an insightful comment. Regarding ‘salami slicing’, the suggested explanation is that this was a healthy case of slicing (can call it ‘vegan salami slicing’). It’s not authors trying to game the system and publish multiple papers instead of one, but it’s authors publishing early/interim results while experimentation was on hold.
Dear Christos, I think “salami slicing” has a meaning that is broadly understood to be a questionable research practice, with the intent indeed to game the system. In my view, it does not help to use it for something quite different and supposedly positive (or “healthy”). If anything at all, it seems you are referring to an undercooked salami… (still probably unhealthy).
Do you think the unusual increase in published articles in 2020 could also be due to journals publishing what was already submitted before 2020 (since I know sometimes it can take quite a while from submission to actual publication) plus journals speedily publishing COVID (and maybe other) content submitted during 2020?
Hi Cami, faster publishing might have something to do with it. But there are reports of strong submissions growth (see top of article – Elsevier reports 25% submissions growth), and in my experience, when submissions suddenly increase, there are slowdowns – submissions can grow overnight, but publishing teams cannot. So my guess is that the growth of submissions resulted to processing slowdowns, and as a result the growth of publications took place with a lag, possibly extending into 2021.