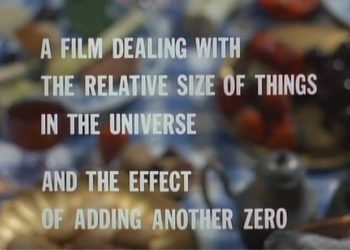
The visual display of quantitative information is essential to scholarly publishing. Data is collected, but must be presented in a meaningful and understandable manner. Unique and interesting ways to offer a sense of scale have long been a fascination at this blog, going back to the Eames’ groundbreaking Powers of Ten. Today though we look at a different type of scale, not of size, but of time.
In the video below, the folks from To Scale map out both the timeline of human existence and the entire timeline of the universe itself. To do so, they needed a lot of space, so they spent a day in the Mojave Desert plotting out time to distance. Most remarkable here is seeing human existence put into context, occupying the last few feet of a 4.3 mile plot.

Discussion
5 Thoughts on "The Size of Things: Time in Context"
“What’s important with the time you have?” Beautiful video.
here is another fun way to connect us to our place in time – brought to us by Smithsonian Magazine – enter your address and pick your eon.
https://www.smithsonianmag.com/smart-news/map-lets-you-plug-your-address-see-how-neighborhood-has-changed-over-past-750-million-years-180971507/
terrific video & perspective.
A sensational way to provide a little perspective! Brilliant!
Was that Einstein in the car?