Editor’s Note: Today’s post is by Christos Petrou, founder and Chief Analyst at Scholarly Intelligence and Lead Analyst at Signals. Christos is a former analyst of the Web of Science Group at Clarivate and the Open Access portfolio at Springer Nature. A geneticist by training, he previously worked in agriculture and as a consultant for Kearney, and he holds an MBA from INSEAD.
Retractions and research misconduct are the talk of the town. Nature wrote about this topic, Science did too, and so did several mainstream media outlets such as The Guardian, Forbes, and The Irish Times. The Freakonomics podcast dedicated two sessions on the topic, and The Scholarly Kitchen has hosted several nuanced contributions (e.g., see here by Angela Cochran and here by Roohi Ghosh).
Not all retractions stem from research misconduct, but some do. To the extent that retractions are a reflection of underlying research misconduct, a growth in retractions suggests that research misconduct is getting worse. The 10,000 retractions in 2023 compare to about as many retractions in the three-year period from 2020 to 2022. Misconduct appears to be getting worse at an alarming rate.
In addition to eroding the foundations of future research, it makes for a grim picture for stakeholders in the scholarly world. Researchers, institutions, funders, publishers, and service providers are made to look unreliable, and they risk losing the trust of the public.
The numbers speak for themselves, don’t they? Well, I am not convinced. I believe that when it comes to retractions the conversation has been guided by incomplete, attention-grabbing analysis: man bites dog. Here, I share some snippets of quantitative analysis as a counterweight to collective alarmism. I show that growth in retractions has not been universal across regions and subject areas, and it is primarily driven by the industrial-scale activity of papermills (rather than the activity of individual researchers) and the growth of research from China.
The story so far
It is true that the volume of retractions has dramatically increased in recent years, and so has the rate of retractions per paper, which stood at 3.5 retractions per 10,000 papers in 2014 and reached 11.2 retractions per 10,000 papers in 2022. In other words, in 2022 there were three times as many retractions per paper in comparison to 2014.

The analysis is based on data from Scimago and retractions in the Retraction Watch (RW) database. It utilizes retractions for Research Articles, Review Articles, Clinical Studies, and Case Reports, and it does not include 2023 data as the RW database is not yet complete. The rates are based on the average publication volume of the three years prior to retraction year in order to account for the lag between a paper’s publication and its retraction. Finally, RW reports retractions for journals that may not be included by Scimago, meaning that the retraction rates shown here are slight overestimates.
Journal breaches
Let’s dig deeper. In 2014, there were only two journals with more than 20 retractions, which accounted for 10% of all retractions, whereas in 2022, there were 34 journals with more than 20 retractions, accounting for 51% of all retractions. I refer to those instances of mass retractions (>20 in a calendar year) as journal breaches, whereby the peer review process of a journal is severely compromised and it becomes a target of papermills and corrupt researchers.

Once uncommon, journal breaches now account for half of retractions. I believe that they reflect the sinister ingenuity of papermills that have converted misplaced author incentives into a business model and have exploited weak spots in publisher workflows. They are not suggestive of growing maliciousness across researchers, growing incentives to publish (else perish), or a general weakening of publishing governance and editorial rigor, despite exceptions such as Wiley’s Hindawi portfolio. The common belief is that the APC model encourages volume at the expense of editorial rigor, but that does not square with the fact that 8 of the 12 (non-Hindawi) journals that had more than 40 retractions in 2022 are not fully-OA; they are hybrid, and 87% of their retractions are behind a paywall, per Dimensions.
It is likely that fraudulent papers in breaches are easier to detect and address than individual fraudulent papers. It is easier to spot a cluster of bogus papers that may be published within the same special issue than single problematic papers that are hidden among hundreds of legitimate ones.
Serial offenders
Retractions by serial offenders (authors with more than 10 retractions in their retracting career) have also become more common (more than tripled from 89 in 2014 to 330 in 2022), but they account for a steady share of ~11% of all retractions. This is an underestimate, as the calculation excludes authors with likely Chinese names that can be hard to disambiguate (the surnames Li, Wang, and Zhang collectively cover around 20-25% of the entire Chinese population).
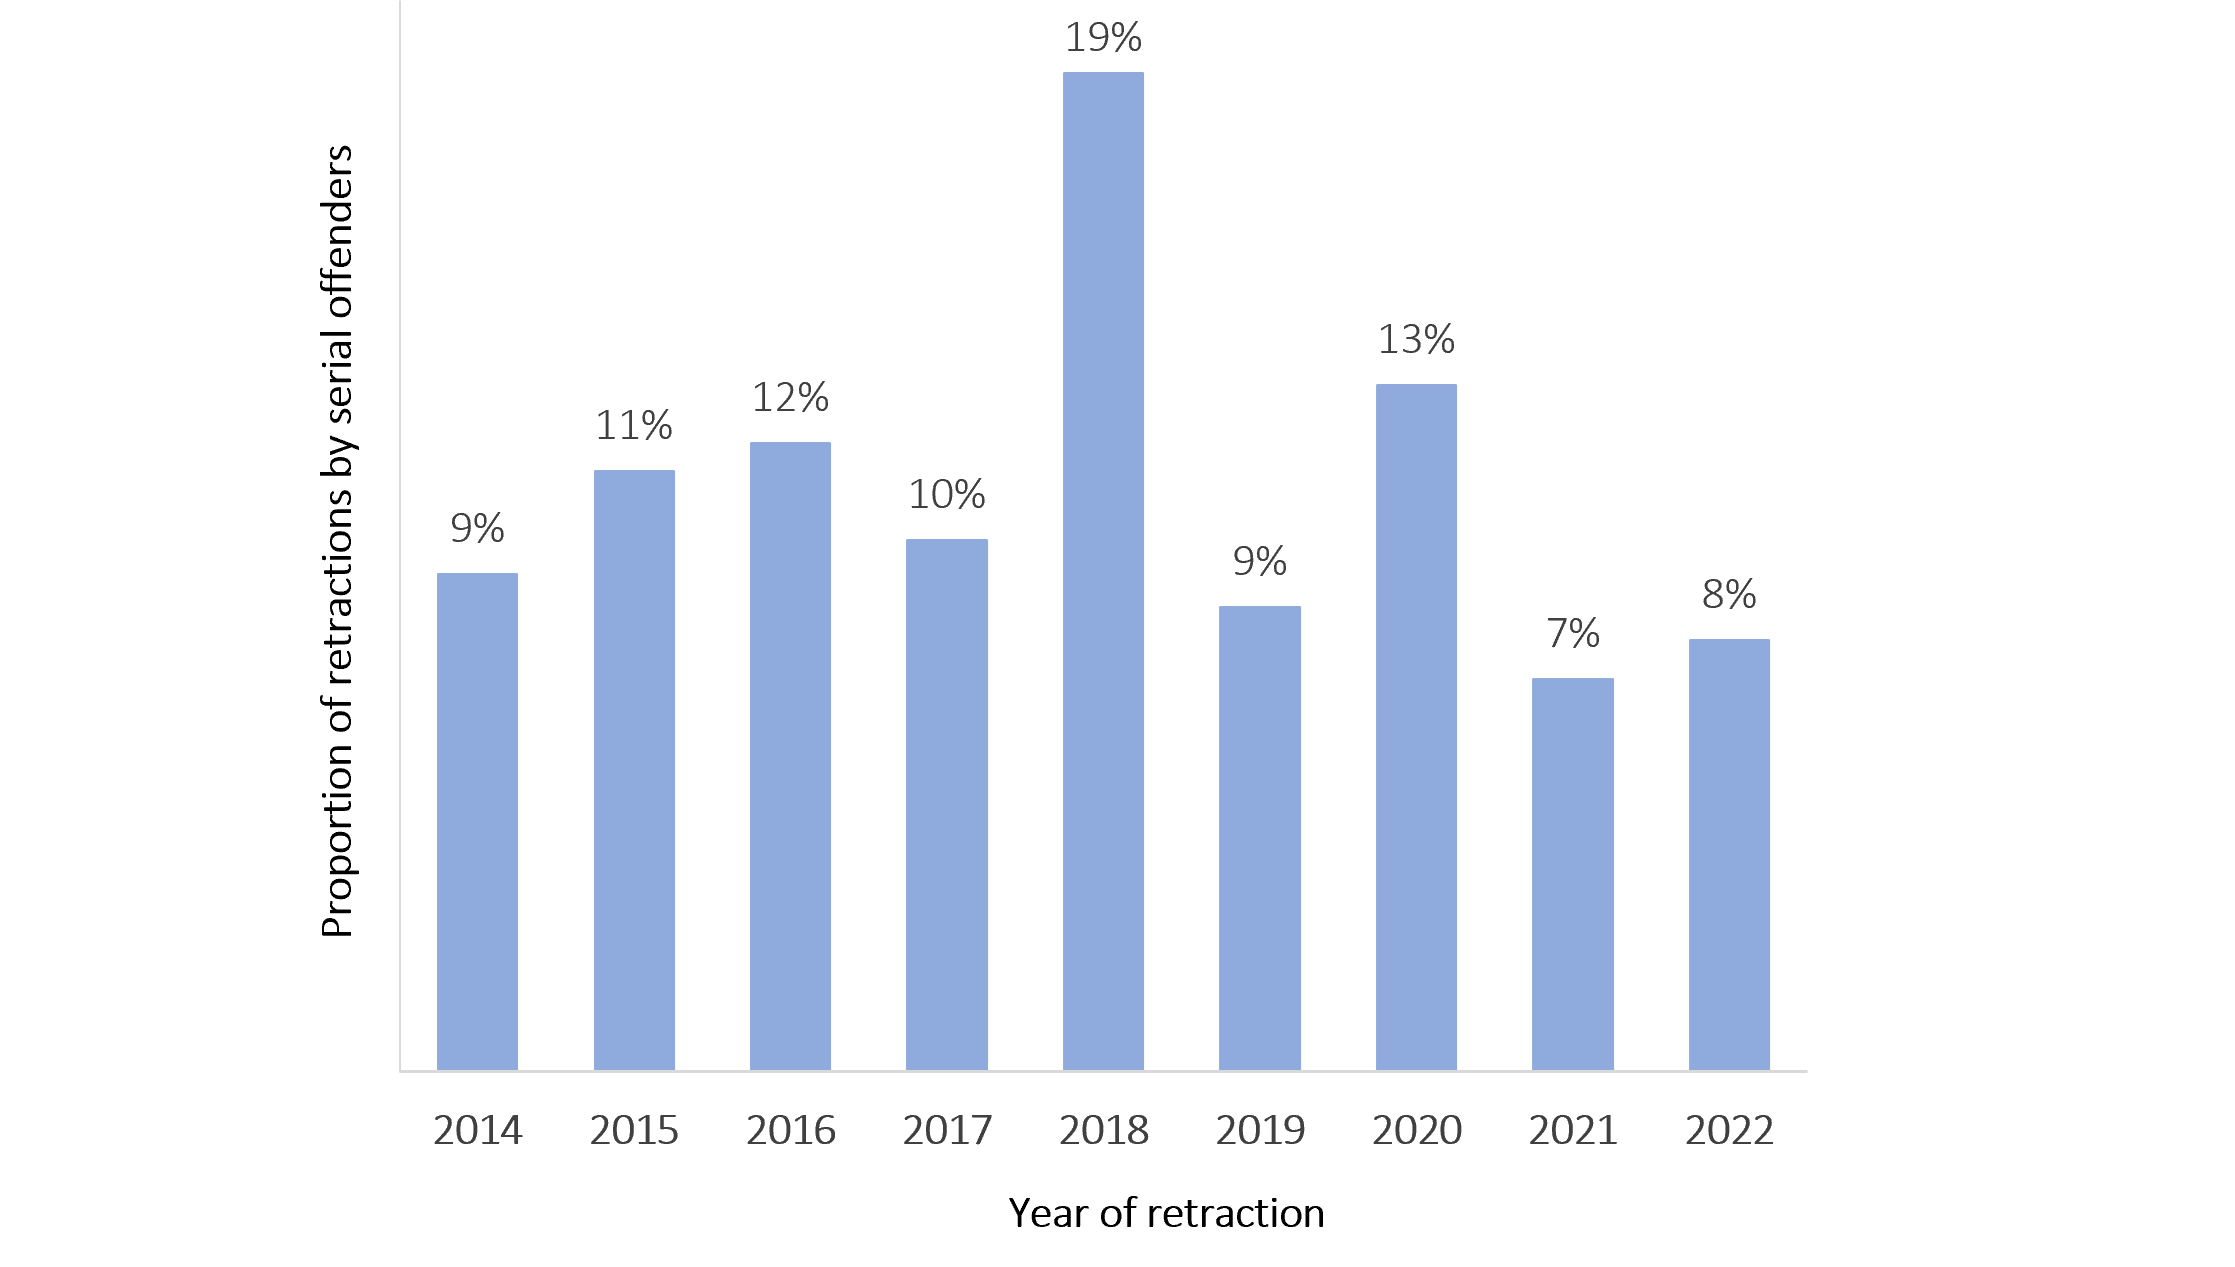
The significance of serial offenders is localized. For example, Japanese retraction heavyweights Yoshitaka Fujii, Hironobu Ueshima, and Yoshihiro Sato accounted for 38% of all Japanese retractions from 2011 to 2022. They never co-authored a paper, despite all three authoring in Medicine and two of them in the field of Anesthesiology. One has to wonder what they might have achieved if they had joined forces.
China
Land of prosperity and peril for the publishers that have tried their luck there, China (and by extension the world) has a misconduct problem. The country is aware of the problem and is taking action to size it and address it.
The retraction rate of China is dramatic, reaching 26.1 retractions per 10,000 papers in the period from 2020 to 2022, compared to 5.9 for the rest of the world. China might not be the world leader when it comes to retraction rate (the top spot is claimed by Saudi Arabia with 31.6 retractions per 10,000 papers from 2020 to 2022), but the country matters because of its size and growth. It accounted for 17% of papers and 16% of retractions in 2014, climbing to 26% of papers and 54% of retractions in 2022.

China’s misconduct issues cross its borders and become everyone’s issues. That is especially true in the fields of Medicine and Biological Sciences which tend to show high retraction rates in any country. For example, China achieved an unenviable rate of 113 retractions per 10,000 papers from 2020 to 2022 in the area of Biochemistry, Genetics and Molecular Biology. Please read that slowly and let it sink in: 1.1% of published papers from Biochemistry, Genetics and Molecular Biology from China ended up retracted.
To the extent that retractions only capture the tip of the iceberg, it is likely that Medicine and Biological Sciences are swamped with unreliable research from China. Moreover, editorial work must be particularly challenging when dealing with submissions from China: if thousands of bogus papers end up published, one can only assume that tens of thousands are rejected prior to publication.
China’s retraction problems are not universal across subject areas. For example, its retraction rate is below 5.0 papers every 10,000 in the areas of Chemistry, Energy, Mathematics, Earth and Planetary Sciences, Physics and Astronomy, and Materials Science. This rate is not negligible, but it does not stand out. Skepticism about Chinese research should not be indiscriminate.
Beyond the doom and gloom
So how does the global retraction rate look when excluding journal breaches, serial offenders, and China? It certainly looks healthier. Starting off at 2.8 retractions per 10,000 papers in 2014, it grows to 6.7 in 2019, and then declines to 3.1 in 2022. In other words, once accounting for breaches, serial offenders, and China, the world looks the same today as it did eight years ago.

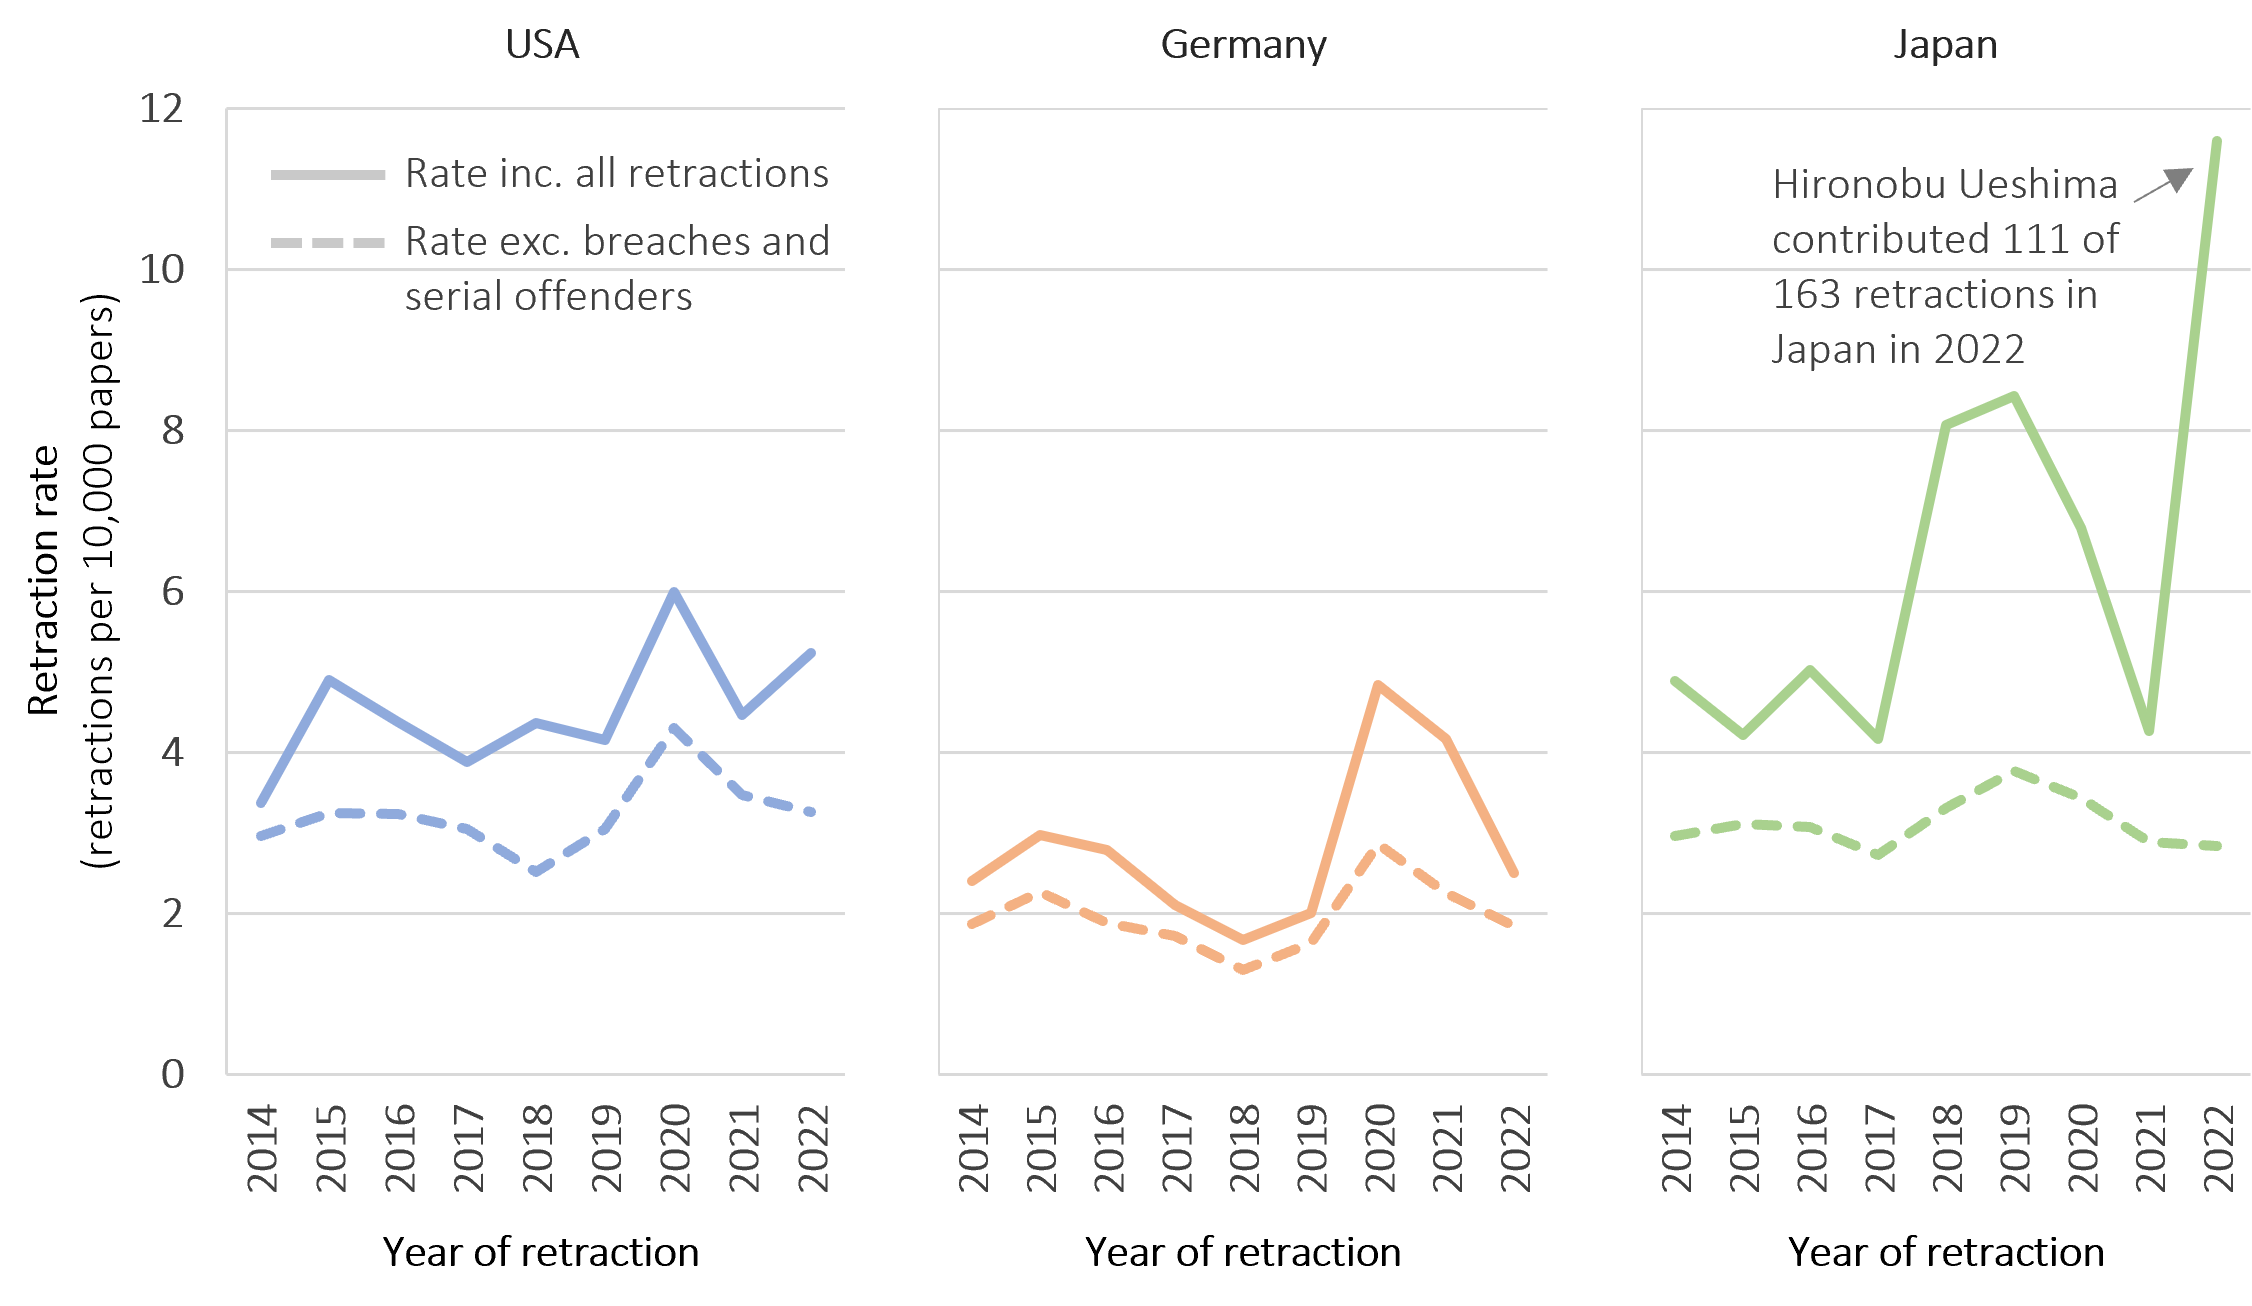
Similarly, an analysis of countries with established research cultures shows that misconduct issues (to the extent captured by retractions) are not aggressively deteriorating. The USA, Germany, and Japan have maintained low rates, typically not exceeding 5.0 retractions per 10,000 papers, which drop below 4.0 when excluding breaches and serial offenders and below 3.0 when further excluding retractions that are unrelated to misconduct (e.g., labelled as errors by RW). Notably, these countries faced fewer than 1.0 retraction per 10,000 papers in the area of Materials Science from 2020 to 2022.
Journal governance and balanced incentives
The results suggest that misconduct is not out of control across several demographics, and targeted interventions can go a long way toward addressing the challenge of misconduct to the extent that it is reflected in retractions.
First, breaches occur more frequently when journals and publishers are not vigilant. Contrary to Wiley’s portrayal in the notable Hindawi portfolio breach, well-functioning journals are unlikely targets for papermill takeovers. Robust journal governance is essential to detecting and deterring large scale attacks by papermills, and it can substantially reduce the presence of papermill papers in the mainstream literature. Technological solutions may complement this effort, but will not be effective in the absence of good journal governance.
Next, China should rethink its incentives structures for researchers in Medicine and Biological Sciences. The benefit of a successful intervention would be felt worldwide. For example, if China were to halve its retractions in Biochemistry, Genetics and Molecular Biology, the global retraction rate would decline by 14%.
Technology answers the call
It is rare for all research stakeholders to be united in support of a cause as is the case for addressing research misconduct. The vast majority of researchers, funders, institutions, the public, publishers, and service providers find themselves on the same side of the table. Whether misconduct is getting worse or not, it certainly is sizable, so it is welcome that urgency has been created around the matter.
Taking note of the momentum, a growing number of service providers, publishers, and startups have come up with technological solutions to combat misconduct at the point of journal submission or to help clear the academic record from already published bogus papers. For example, Morressier recently raised $16.5m to ‘enable academic societies and publishers to protect research integrity’, Cactus Communications is highlighting the capacity of its Paperpal product to flag problematic papers, Wiley is developing an AI-powered papermill detection service, the STM Research Integrity Hub has brought together dozens of publishers and offers a holistic approach to detect offending manuscripts, and Clear Skies offers a widely discussed Papermill Alarm tool.
Full disclosure: I am part of the founding team of a new startup in this area, Signals, which intends to use network analysis, expert inputs, and a series of automated paper checks to prevent research misconduct from surfacing and to rectify the scholarly record.
Breaches yet to be addressed
It took 3.3 years on average from publication to retraction for papers that were retracted in the period 2018 to 2022. Even if publishers have now become more vigilant about the content they publish, the lag between publication and retraction might be the reason for more breaches to be uncovered in 2024 and 2025.
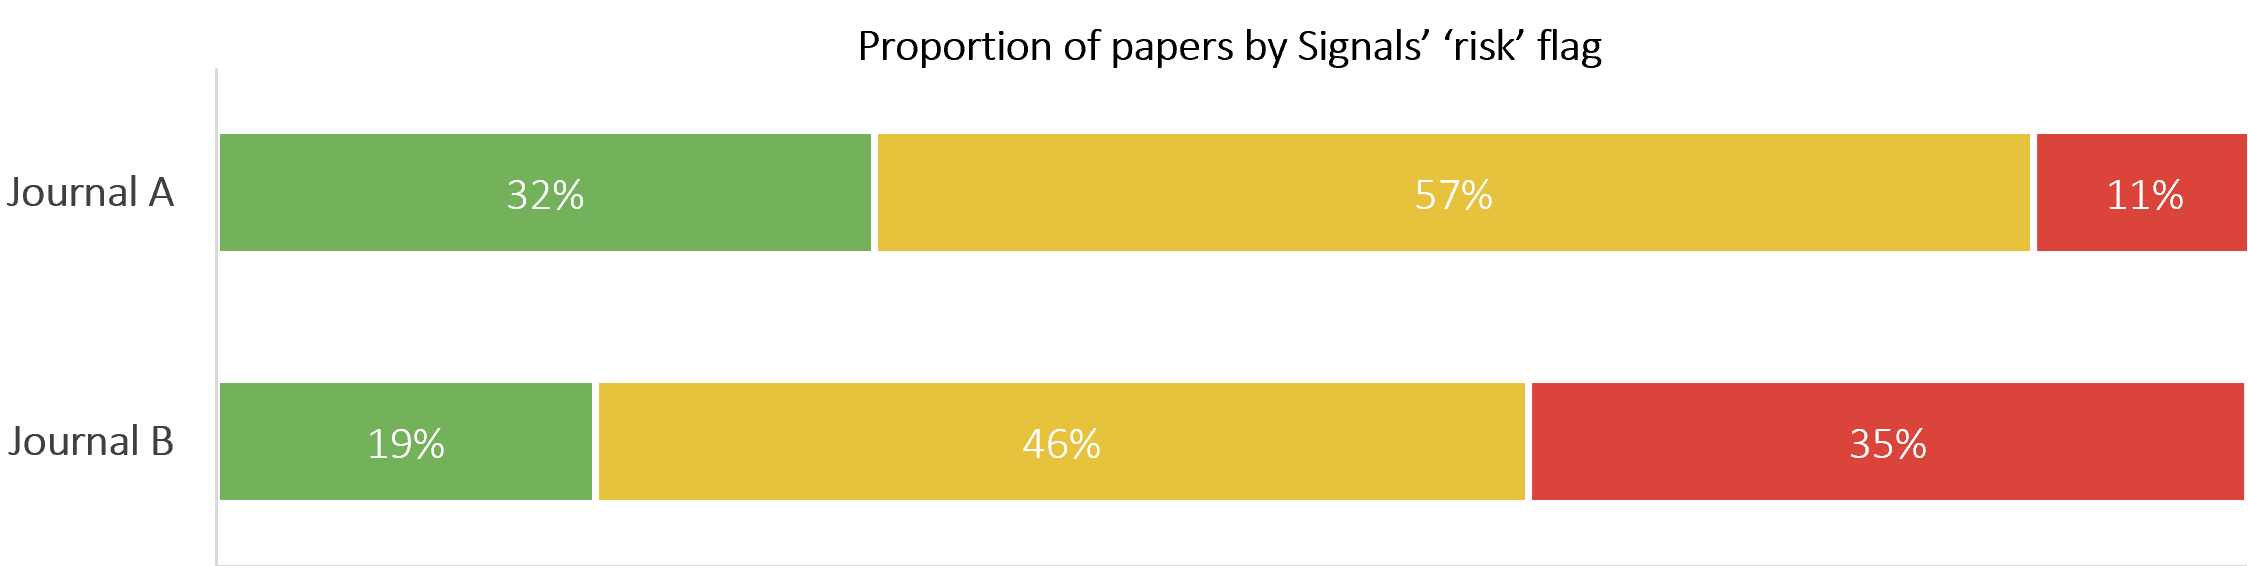
Take for example the two journals presented anonymously here as Journal A and Journal B. Based on appearances, these are two reliable journals. They are published by large, traditional, reputable publishers, and they are indexed in several prestigious databases, such as the Web of Science, Scopus, DOAJ, and PubMed. They both have an Impact Factor above 3.0, are fully Open Access, and publish content in Biomedicine or Biological Sciences. Neither journal reports any retractions for papers published in 2022 and 2023.
A closer look into Journal A shows that it gets more than two-thirds of its papers from China, Egypt, Iran, Pakistan, or Saudi Arabia. Nothing wrong with that, but several of the journal’s papers have been noted for citing retracted articles, showing anomalies in authorship, not referring to any of the authors’ past works, showing unexpected low turnaround time, and so on. For example, more than half of the journal’s papers did not cite the previous works of its authors. This can be fine at the paper-level and for a few papers of a journal, but it can be problematic when it applies to a high volume of papers.
Journal B stands out for its abnormal volume patterns. It increased its paper output more than five-fold from 2020 to 2021, maintained the high output into 2022, and then shrunk again in 2023. During the high-volume period, the journal got more than 80% of its papers from China, and after shrinking, the proportion of papers from China dropped below 20%. Same as in Journal A, there is an abundance of articles with citations to retracted papermill articles and no mention of previously published works by any of the authors, among other issues.
The publishers of these and other problematic journals have been contacted directly so that they may take the appropriate action in line with COPE guidance. Meanwhile, the publishing world should brace itself for a couple of years with high volumes of retractions. We might have seen the worst of it in 2023, but we are not out of the woods yet.
Discussion
10 Thoughts on "Guest Post – Making Sense of Retractions and Tackling Research Misconduct"
An error by the author. This should have read: ‘1.1% of published papers from China in Biochemistry, Genetics and Molecular Biology ended up retracted.’
Now updated, thanks.
Thanks Christos, excellent summary – an additional question, to your knowledge, has their ever been a study of retracted articles, or known papermilled articles, where the underlying research data was made openly available along with the article?
One might hypothesize that the greater transparency of having the research data made open along side the article, (as is likely to be mandated more and more funders), might lead to less retractions, but then again, it’s possible more errors could be found within the underlying data. Similar it would be interesting to know how many articles are retracted due to image manipulation reasons? Food for thought and further discussion.
Thank you for reading, Adrian.
Starting with your second question, the RW database cites the reasons for each retraction, so it is possible to see the proportion of papers retracted for image manipulation. I’ve played around with that data, but the article was becoming too long to include additional analysis.
Regarding open data, you’d expect that it’d make cheating more difficult, but I have no data to share.
I think you’re probably right. But I don’t think that’s a solution to the papermill problem.
Anecdotally, if a journal suspects it is being targeted by a papermill one way it can shut such an attack down is to require all authors to supply original research data in confidence as part of peer review. This encourages the papermill to seek a softer target than incur the extra effort and cost of creating and supplying fake data. Which is find for an individual journal. But if journals were to systematically and collectively require this, I’m sure the papermills would respond with the systematic use of generative AI to produce fake data to meet this requirement. If they aren’t already.
And I fear the widespread adoption of open data mandates will probably do the same.
“Has their ever been a study of retracted articles, or known papermilled articles, where the underlying research data was made openly available along with the article?”
In the former case, yeas: an analysis of retraction statistics as a function of journal open data policy: https://www.nature.com/articles/s41559-022-01879-9
I don’t have access to the right databases to calculate this accurately, but I think we are looking at a ~4% retraction rate for papers from China in Cancer in 2022.
I believe the problem is journals and publishing houses dislike retracting papers. Which is the wrong approach retraction of papers mean there is a retrospective quality control by the journal/publishing house and could be seen as improving the integrity of the publishing house/journal.
Another positive step would be to pay reviewers in the review process which makes the reviewer contracted to undertake work to a specified standard. But also maybe authors naming reviewers should be stopped.
We recently published a article describing the distribution of retractions across disciplines and topics. We find that:
1. Misconduct occurs across all disciplines, with several topics being more severe, like micro&lncRNA, telecomunications.
2. Reasons for misconduct exhibit distinctive patterns among various topics. Papermill, fake peer review, and AIGC become the major problems.
Please see the following paper, it is OA.
Li M. and Shen Z. (2024). Science map of academic misconduct. The Innovation 5(2), 100593
https://doi.org/10.1016/j.xinn.2024.100593
I take comfort in knowing that no reasonable, well-meaning human being will take this comment seriously.