Data for the second year of the SSP Compensation and Benefits Benchmarking Study — an annual global benchmarking survey gathering information on wages, compensation, benefits, policies, and skills from individuals working in scholarly communications and the organizations that employ them — is now available.
The window for submitting 2025 data (and securing free access to select data points) is drawing to a close (March 31). There are already more than 160 responses for the individual study. We have made reporting available now that we have a sufficient number of data points to provide meaningful comparisons. Reports are dynamically generated, so as more individuals complete the survey, more comparison data will be available. The insights shared here are a snapshot based on the data available as of March 20, 2026.
General areas that are included in the individual study include education, experience, work satisfaction, compensation, healthcare, retirement plans and additional benefits, paid time off, and the specific skills that are most important for positions in scholarly communications.
We made a few changes to the survey based on the feedback we received last year. The survey is now more appropriate for a global workforce and includes a few new questions around worker satisfaction and salary increases.
Now that we have two years of data, we’re able to make some comparisons longitudinally. You can view highlights from last year in this previous Scholarly Kitchen article. I also want to explore some of the responses to the new questions we added.
Participant Profile
Despite having about half as many respondents in year 2 (so far), the participant profile is very similar. Ninety-six percent (96%) of individual respondents are employed full-time. The majority, 81%, live in North America, with 79% residing in the US. Europe and Central Asia are represented by 16% of respondents (12% located in the UK). Two percent (2%) reported East Asia and the Pacific as their region of residence.
Looking at the US distribution (as defined by the US Bureau of Economic Analysis), publishing professionals are definitely more concentrated in the East (nearly 70%) with Mid-East states (New York, Pennsylvania, Maryland, Delaware, New Jersey, Maryland, and Washington, DC) having the highest number of respondents (33%). The Southeast is also well represented with 28%, followed by New England at 11%. The rest of the US including the Far West, Southwest, Plains, Great Lakes, and Rocky Mountain regions account for 28% of respondents collectively.
Women make up the majority of respondents (72%), followed by men (25%) and 2% are non-binary or Gender Diverse.
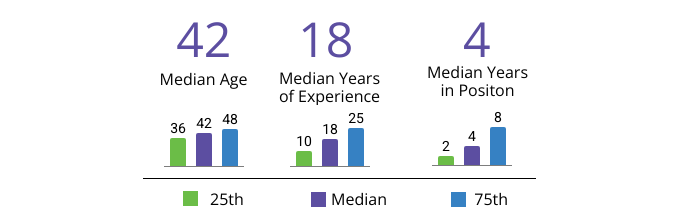
Ninety-eight (98%) of respondents hold a bachelor’s degree or higher. Fifty-six (56%) percent supervise others; up from 54% last year. The median age is 42. The median years of experience is 18 years with a median of 4 years in their current position.
The majority (54%) of respondents indicated their current employer is a society/association/non-profit publisher, followed by commercial publishers (23%), and industry service providers (7%). Also represented are university presses and libraries at 4% each and post-secondary institutions, government, and consulting organizations at 2% or less each.
Thirty-six percent (36%) of respondents work for organizations with 500+ employees while 42% work for an organization with 50–499 employees. Twenty-three percent (23%) work for organizations with fewer than 50 FTEs.
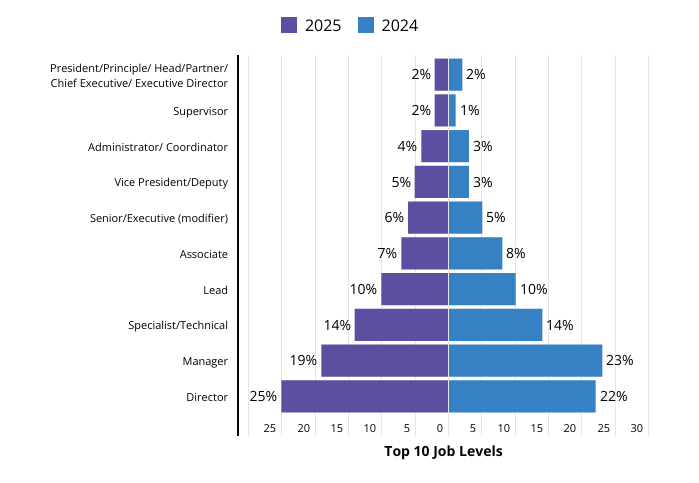
The distribution of job levels is very similar to last year. Focusing on the top five, 25% of respondents identify as a Director, 19% report their job level as Manager, 14% are in Specialist/Technical roles, 10% selected Lead, and 7% marked Associate.
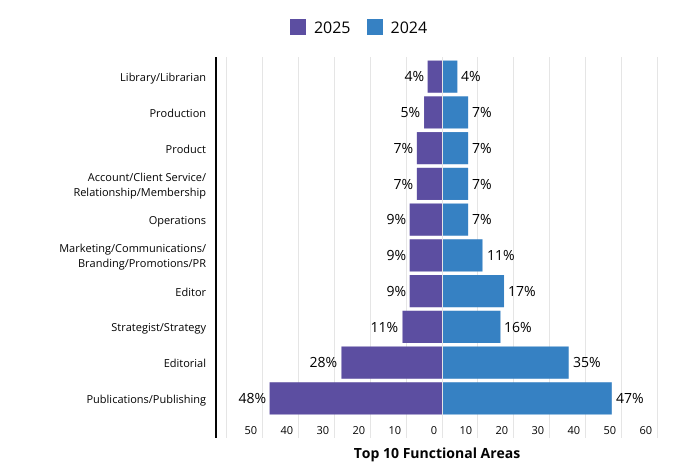
Functional area is probably the metric where we see the most variance year over year, albeit still relatively minor. Publications/Publishing (48%) still remains the top response followed by Editorial (28%), Strategy (11%), and Editor, Marketing, and Operations (9% each).
Compensation
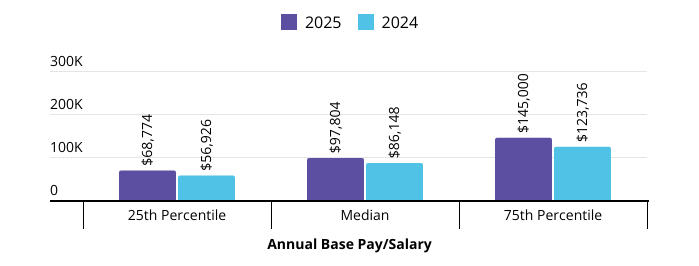
Despite a relatively similar respondent profile on the surface, compensation is a category where we see significant year/year variance. The median annual base pay/salary (excluding bonuses and commissions) for 2025 is $97,804 compared to $86,148 for 2024—an increase of 13.4%.
Comparing that with the data from one of the new questions—percentage of salary increase from 2024 to 2025, with a median of 3%— confirms that despite the profile being similar year/year, the actual respondents are likely different and those variances are not attributable to generous annual increases.
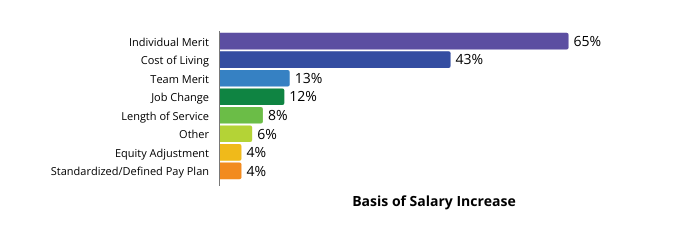
Increases in pay were mostly awarded based on individual merit (65%) and increased cost of living (43%). Wage increases for the industry are still slightly outpacing inflation. The US inflation rate, as measured by the Consumer Price Index (CPI), ended 2025 at 2.7% in December.
Compensation, of course, is the heart of the study, so if you want to dig deeper into this data and apply filters based on job level, function, etc., I encourage you to participate or subscribe.
Work Satisfaction
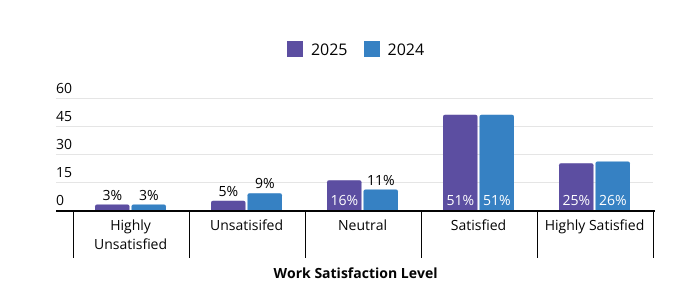
Work satisfaction remains strong with 76% citing their satisfaction level as satisfied or highly satisfied — just one percentage point lower than the prior year.
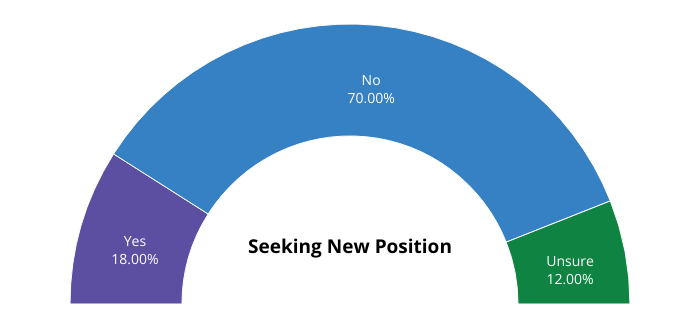
There is no change in the percentage of scholarly communications professionals seeking new positions year/year, remaining at 18%. Probably a good thing, as job vacancies seem to be scarcer according to Indeed’s 2026 US Jobs & Hiring Trends Report: “Demand for workers has softened, but layoffs have remained generally low and workers are staying put, leading to a ‘low hire, low fire’ environment… Employers are cautious, weighing every new hire against an uncertain backdrop of inflation, tariffs and global economic volatility.” Unemployment rates in the US continue to climb year/year, hitting 4.4% at the end of 2025 according to the US Bureau of Labor Statistics.
Thirty-four (34%) of employees don’t feel like there are advancement/promotion opportunities within their organizations, while 38% feel these opportunities do exist. However, 10% feel that they would require significant reskilling to climb the ladder internally.
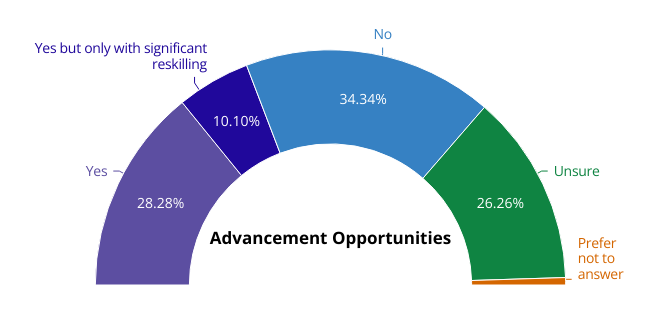
Organizations that prioritize internal promotion often see measurable gains in both performance and retention. Research highlighted by the Society for Human Resource Management shows that employees who make internal moves are significantly more likely to stay with their employer, reducing turnover costs and preserving institutional knowledge.
Gallup reports that clear internal career pathways are strongly correlated with higher engagement, innovation, and productivity, as employees are more likely to invest in organizations where advancement feels attainable and transparent. It stands to reason that employers in our industry could benefit from being more transparent about advancement pathways.
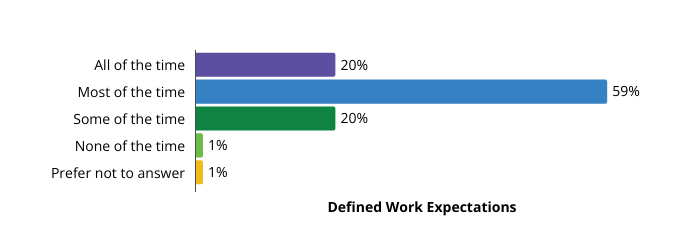
Employers in scholarly communications get a passing grade when it comes to defining work expectations. Nearly 80% of respondents indicated that they feel their job duties and work expectations are clearly defined at least most of the time.
Research consistently shows that work-life balance is closely linked to both employee engagement and productivity. When individuals feel they have sufficient time and flexibility to manage personal and professional responsibilities, they are more likely to be focused, motivated, and committed in their roles. Findings from Gallup indicate that employees who report higher well-being — including balance and manageable workloads — are significantly more engaged and experience lower burnout, which in turn supports stronger performance outcomes.
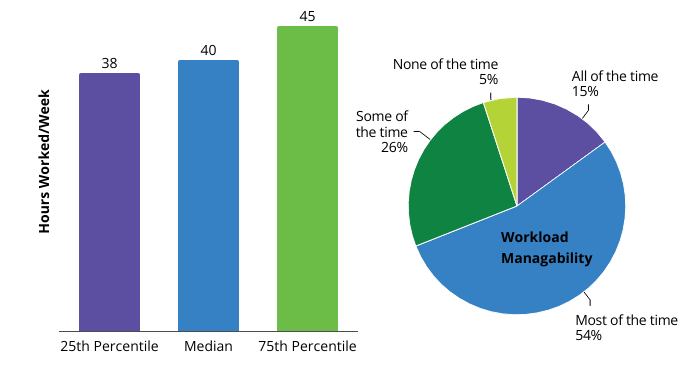
When it comes to workload, 54% of respondents feel their workload is manageable most of the time and 15% report it’s manageable all of the time. The median hours worked per week (regardless of how many are paid) is 40. We didn’t specifically ask how many hours respondents are paid for, but 96% indicated they are full-time workers. That suggests that scholarly communications places a high value on work-life balance. According to the US Bureau of Labor Statistics, the US national average is 42 hours per week.
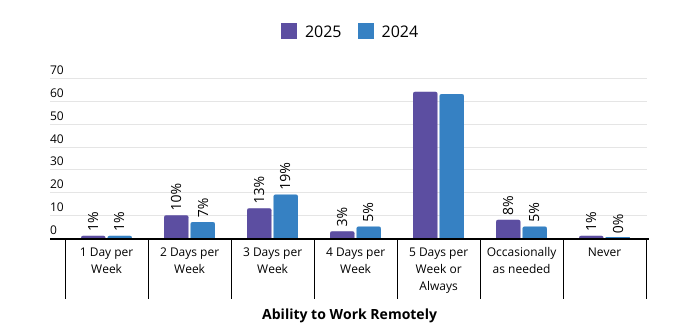
Perhaps the strong sense of work-life balance also stems from the industry’s continued support of remote work. Compared to last year, an even higher percentage (64%) of respondents are able to work remotely five days per week and 80% have the opportunity to work remotely at least three days per week.
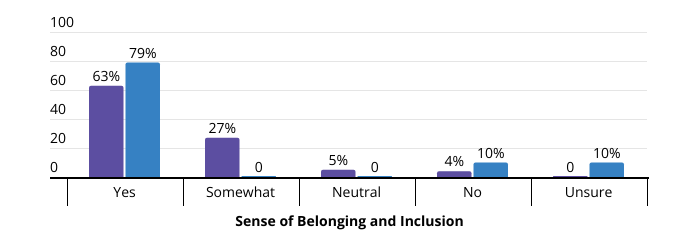
One concerning data point is the decrease year/year of those that feel a sense of belonging and inclusion within their organization. It’s difficult to ascertain if our industry-wide DEIA efforts are slipping, if the change is attributable to a new set of respondents, or if other factors are at play. On the positive side, there is a shift of 6% from those responding “no” in the prior year into a feeling of “neutral, somewhat, or yes.”
Skills for the Future
Leadership and strategic planning continue to top the list of the interpersonal or transferable skills our respondents would most like to develop (hmm, I wonder if they have checked out the SSP Leadership Academy yet?). Presentation or public speaking edged out networking this year to gain a space in the top five.
| Top five interpersonal or transferable skills respondents would most like to develop for their future career goals. | 2025 | 2024 |
| Leadership | 51% | 49% |
| Strategic Planning | 46% | 46% |
| Negotiation | 34% | 39% |
| People Management | 32% | 34% |
| Presentation or Public Speaking | 28% | 24% |
| Networking | 27% | 26% |
To no one’s surprise, Artificial Intelligence again tops the list of the top five technical or knowledge-based skills our participants would most like to develop for their future career goals. However, it’s slightly lower than last year and data collection, analysis, and reporting is closing the gap. Marketing or industry knowledge is up seven points as well. The continued emphasis on leadership, strategy, and emerging technical skills signals a workforce that is actively preparing for change.
| Top five technical or knowledge-based skills respondents would most like to develop for their future career goals. | 2025 | 2024 |
| Artificial Intelligence | 50% | 52% |
| Data Collection, Analysis, or Reporting | 45% | 40% |
| Market or Industry Knowledge | 40% | 33% |
| Budgeting or Finance | 39% | 38% |
| Developing Proposals or Business Plans | 34% | 36% |
Conclusion
Taken together, the second year of data begins to move this study beyond a snapshot and toward a more meaningful view of how the scholarly communications workforce is evolving over time. As participation grows and the dataset matures, the benchmarking study will become an increasingly valuable shared resource, helping organizations make more informed decisions and supporting professionals as they navigate their careers within a complex and evolving ecosystem.
Accessing Survey Results
There is so much more data to dig into as a participant or subscriber, and optional filters let users see many of these data points filtered to their position characteristics.
The survey and results are hosted on SSP’s Insights Platform. This study is a powerful tool for individuals and organizations in the scholarly publishing industry, helping them make data-driven compensation and career development decisions. Individual participants meeting the minimum participation threshold receive access to a downloadable report comparing their responses of select data points to the aggregate responses, and the ability to filter the results based on position level, area, and focus.
Individuals who want to dive deeper into the study results (whether they participated or not) can purchase a premium access subscription that includes dynamic comparison reports featuring additional filters, including level, area, focus, scope, region at the country and state levels, size of organization, type of organization, years of experience, and headquarters region at the country and state levels for an expanded set of data points.
This study and its future iterations will help shape fair and competitive compensation practices in scholarly communications, providing accurate, research-based data that individuals and organizations can use to make informed decisions. With the data window closing on March 31, there is still time to contribute your voice and ensure the final report is as robust and representative as possible.


