Editor’s note: Today’s post is by Sharon Mattern Büttiker on behalf of the Membership Committee. Sharon is Vice President of Publisher Relations and Content Strategy at Research Solutions, a provider of workflow efficiency solutions for R&D-driven organizations in life sciences, technology and academia.
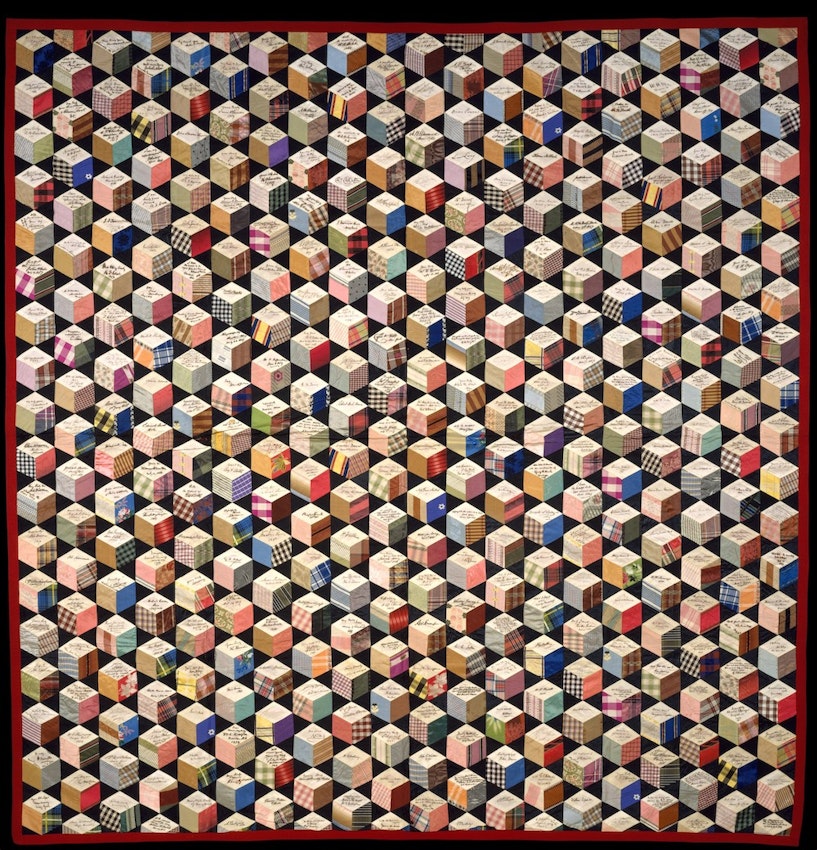
Not unlike a colorful and deeply patterned quilt, the Society for Scholarly Publishing (SSP) continues to be the go-to for scholarly publishing professionals seeking a functional yet vibrant blanket for support and development.
The shining example below completed in circa 1863 by seventeen-year-old Adeline Harris incorporates hundreds of pieces of fabric containing autographs from the luminaries of her time. Taking nearly eight years to complete, the trompe l’oeil tumbling blocks pattern of 360 signed pieces and a total of 1,840 individual silk swatches contains the signatures of Charles Dickens, Ralph Waldo Emerson, Alexander von Humboldt, Jacob Grimm, and eight American Presidents including Abraham Lincoln.
The SSP biannual membership blanket survey concluded in February and yielded an 18% response rate. Thanks again to all members who took the time to share their views. Member feedback helps SSP shape future programs and policy. Below is a picture of SSP in 2024, with the caveat that results presented represent those who participated in the survey, which may not accurately represent the full SSP membership.
Who we are
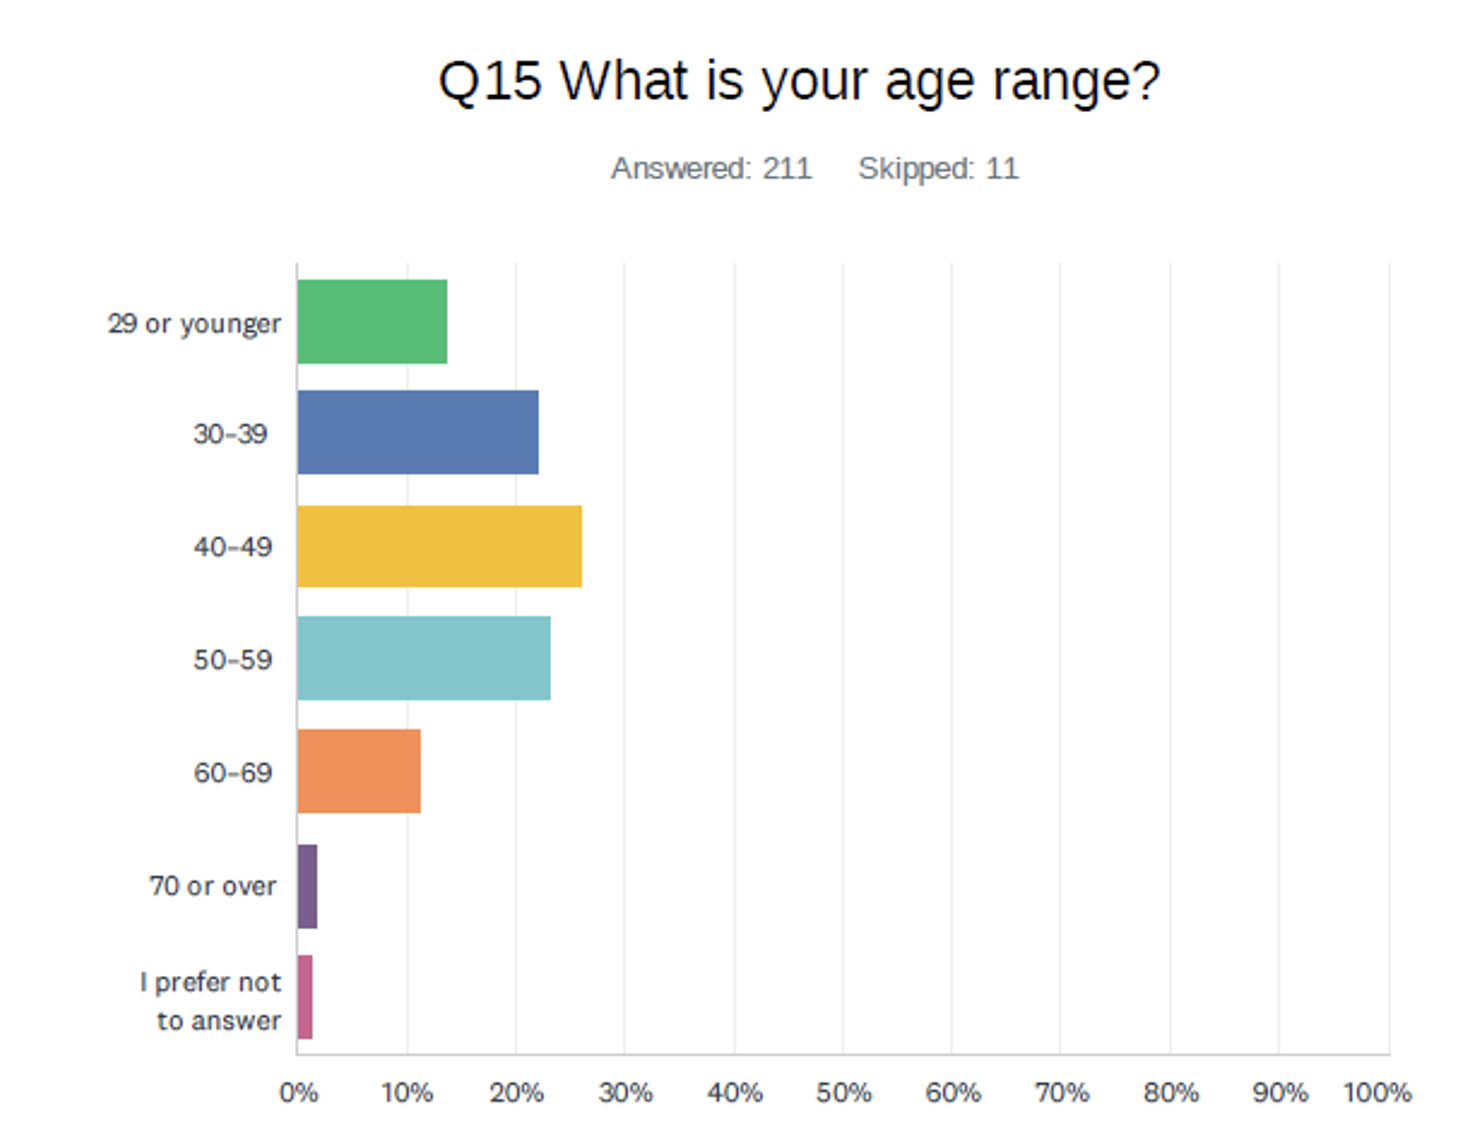
Over 70% of respondents were between the ages of 30-59, with nearly equal distribution among each decade. 14% of respondents were 29 years and younger; 11% were 60-69 years. 1% of respondents were 70+.
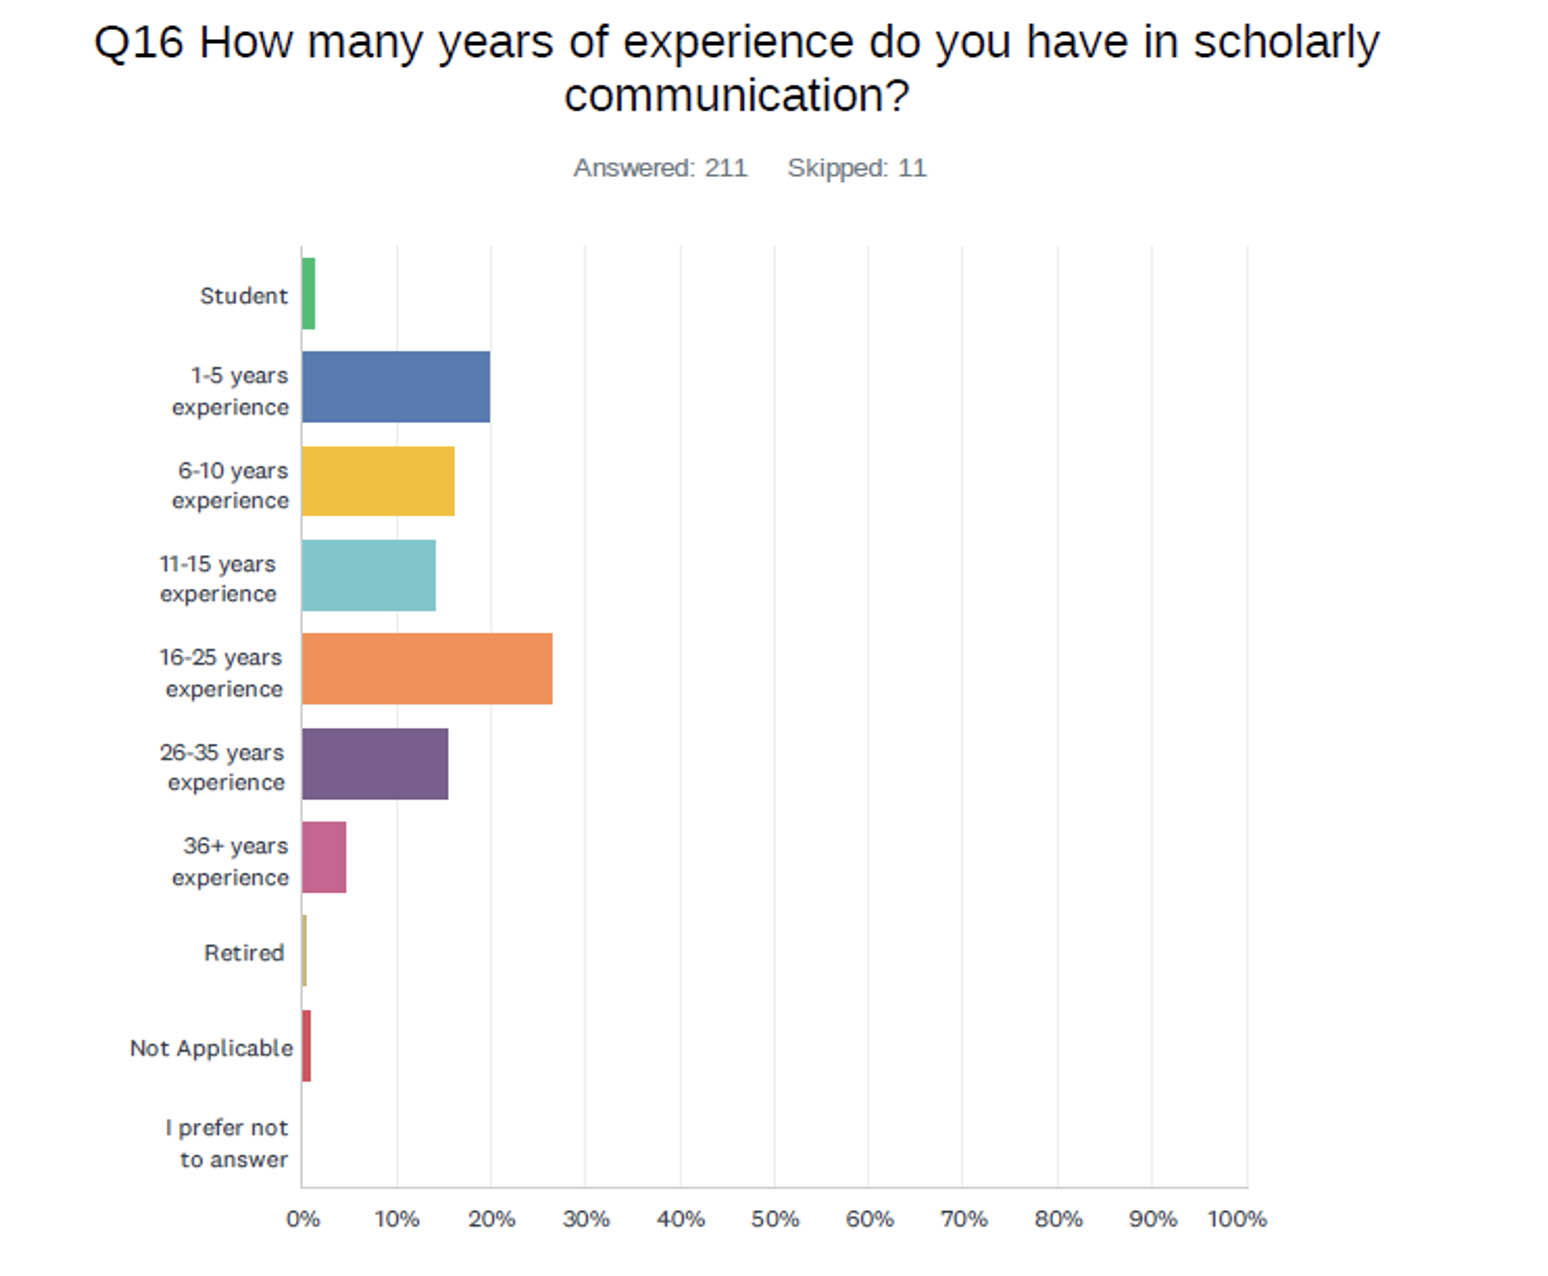
The most prevalent length of experience in scholarly communication is the range 16-25 years (27%) followed by 1-5 years of experience reported by 20% of respondents. It’s worth noting that while one fifth of respondents had spent less than 5 years in scholarly communication, well over half had between 6-25 years’ experience. 16% had 26-35 years’ experience while 5% had 36+ years’ experience. Less than 2% of respondents were students.
61% of those answering the survey identified as female, 36% male, 1% non-binary or gender diverse. 2% preferred not to disclose.
With regard to race and ethnicity, 77% described themselves as White, 9% Black, 6% Asian or Pacific Islander, 6% Hispanic or Latinx. The remaining 2% were indigenous, middle eastern, north African, or multi-ethnic.
What we do
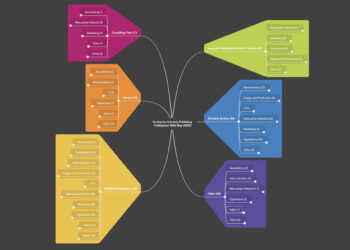
Over 43% of our members are part of a society, association, non-profit publisher, or university press. Workers at commercial publishers make up 9% of our membership, while 28% of members are consultants or work for an industry service provider. Librarians and staff at post-secondary institutions make up 10% of our membership.
The focus of our publishing activities includes but is not limited to journals (64%), science, technology and medicine (42%), research (39%), academic (38%), books (35%) , humanities and social science (19%), Open (19%), multimedia (18%), technology (18%), magazines (17%), databases (14%), and preprints (8%). While functions are wide ranging, many of us are primarily involved in publishing and editorial support, executive management, consultancy, and product development.
Our organizations range in size from 1-10 employees (13%), 11-49 employees (23%), 51-300 employees (34%), larger than 300 employees (25%), and 5% responding n/a.
Why we’re members
The most common reason given for membership is’ to network with other professionals’, closely followed by ‘to promote a product or service’. The next most popular reasons for membership are ‘my organization sponsored my membership’ and ‘professional development and education’. This confirms that SSP members continue to be highly focused on community networking and underscores the role organizational membership plays in our community.
How we engage
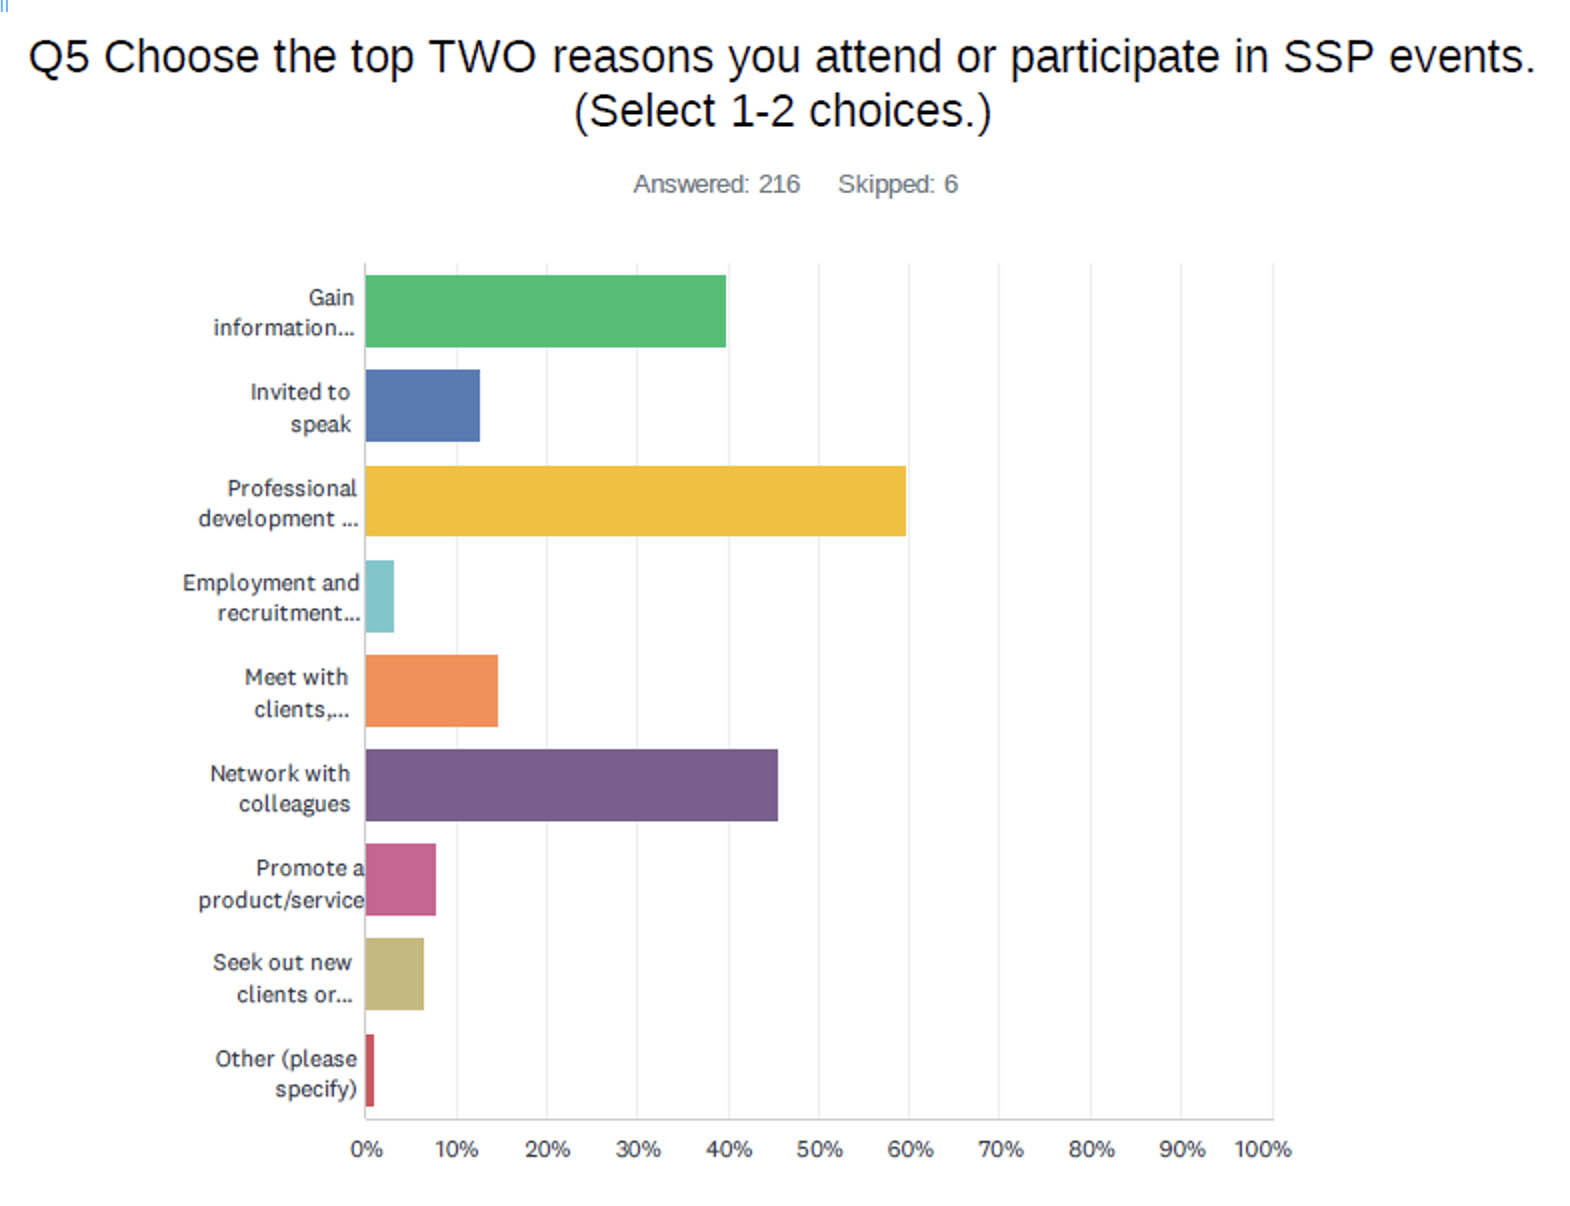
Our main reasons for engagement are for professional development and learning opportunities, to network with colleagues, and to gain information needed in our current roles.
The most useful SSP activities or programs are The Scholarly Kitchen, the Annual Meeting, educational seminars and webinars, followed by the Member Exchange. Resources such as the online Career Center, Mentorship Program, Communities of Interest Network, and the Membership Directory are starting to gain relevancy. Many of us were unaware of resources such as Solutions Source, the OnDemand Library, and access to Learned Publishing.
According to the survey, the Annual Meeting, seminars, workshops, and membership provided the most value compared to price paid. Many respondents noted their high degree of involvement in a committee, task force, or regional group had a positive impact on their satisfaction with SSP. Overall sentiment from respondents was that SSP delivers timely and relevant information, is an ardent supporter of DEIA, provides networking opportunities, is inclusive and welcoming, and provides leadership and volunteer opportunities.
What we’d like to see
Some respondents noted there’s room for improvement in SSP playing a stronger role in personal career development for early and mid-level members. A benchmarking report on compensation for common industry roles was favored by over half of respondents.
It was requested that SSP do more to uphold high standards of research integrity by providing guidance and best practices on responsible conduct, ethical authorship, and conflict of interest disclosure.
Other feedback encouraged diversity and inclusivity within the society by actively reaching out to underrepresented groups, fostering an inclusive environment, and ensuring equitable opportunities for participation and leadership. This includes geographical diversity and speaker diversity, as well as career level diversity.
Work life balance
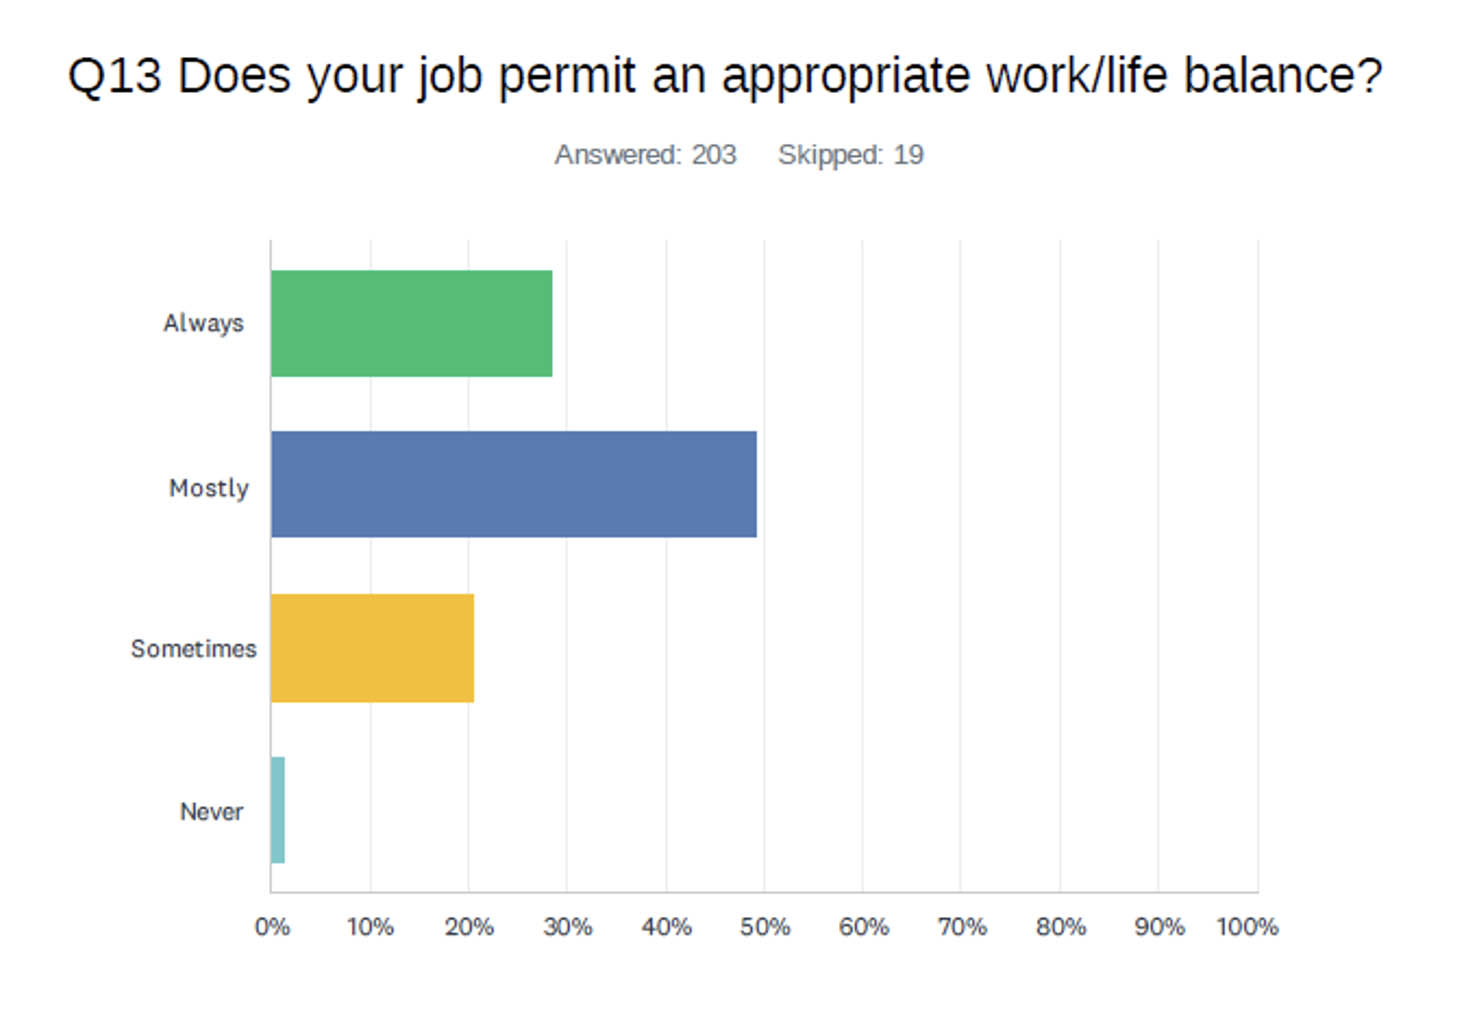
In this year’s survey we asked members questions about whether their job supports a healthy, balanced approach to work. Half of respondents said their job permits an appropriate work life balance ‘most of the time’. One third said ‘always’. 20% said ‘sometimes’. Less than 2% said their job ‘never’ permits an appropriate work life balance.
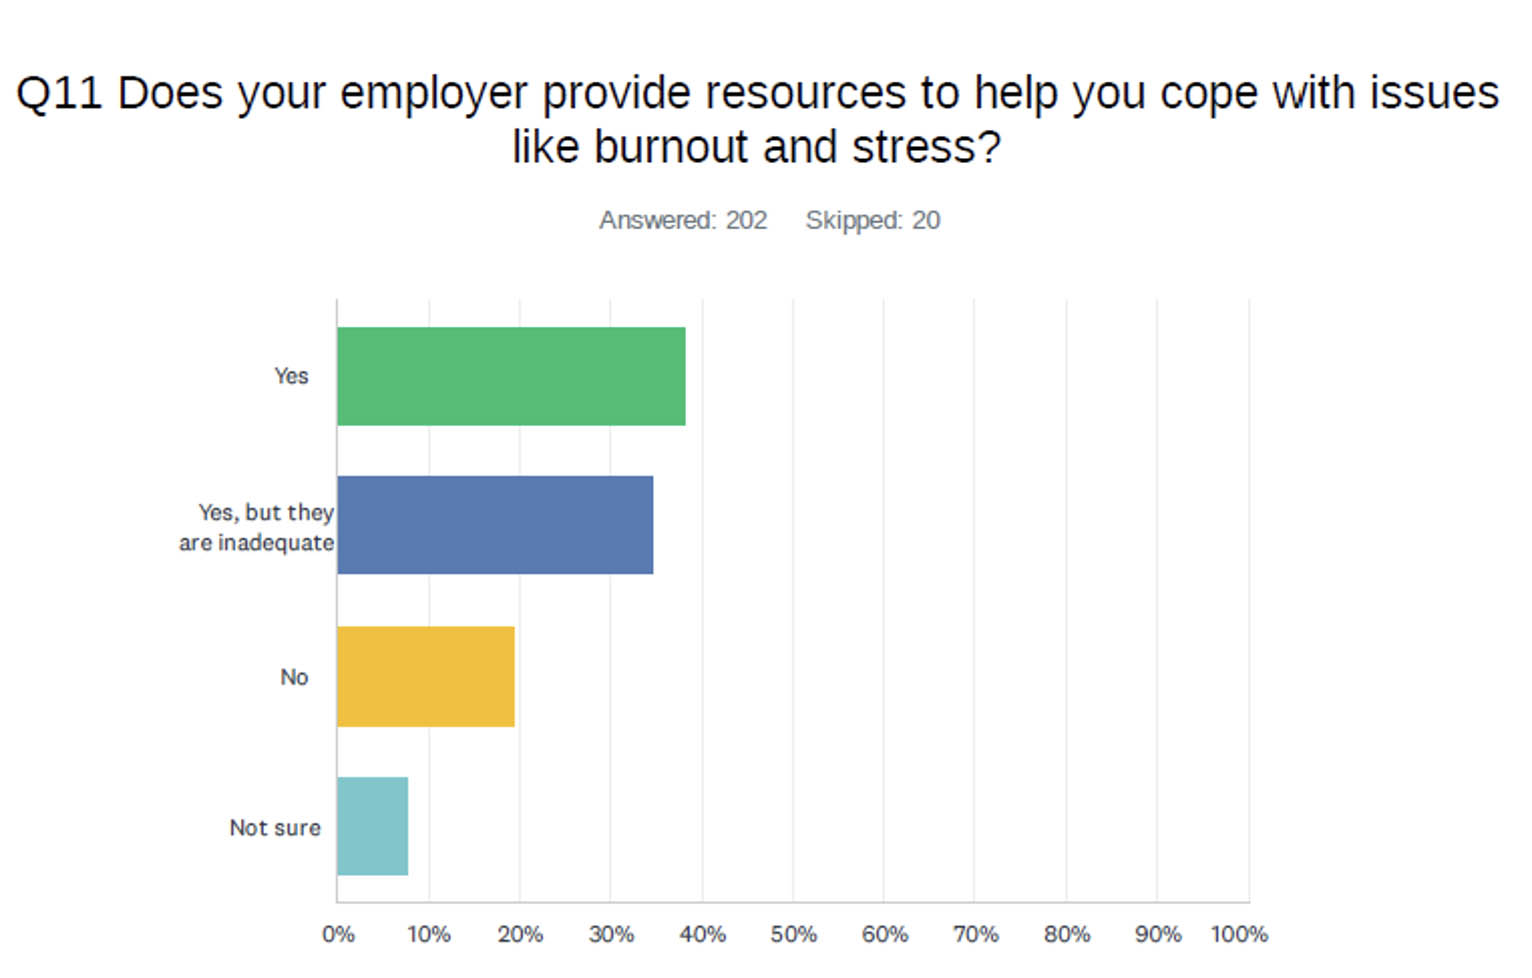
73% of companies provide resources to help cope with burnout and stress issues, of which 34% said those resources are inadequate. 19% said no resources are available. 8% were not sure if help was available. This feedback shows we as a community have a long road ahead to arrive at a balanced approach to work and more resources should be made available.
Feedback from this year’s survey sends an encouraging message for us to continue to work together using a diverse pattern of people, initiatives, and ideas. In doing so, our quilt will continue to expand and support the scholarly publishing community for generations to come.
(adding the fine print:) The statistics were derived from the answers received. Not all questions required responses to complete the survey. For more detailed insights into the survey, please contact info@sspnet.org.
Discussion
2 Thoughts on "Guest Post: Many Patches Make a Quilt — SSP’s Membership Survey"
I’m not a polling statistician, but I am concerned that with an 18% response rate, these results are telling us more about the demographics and opinions of people who like to respond to polls than the demographics and opinions of people who are members of SSP. For example, it seems likely that the poll results have shown a strong correlation between people who respond to polls and people who attend SSP events for development and networks, and a negative correlation for people who do so for commercial activities. What can be done to improve response rates or otherwise validate these results?
Thanks for your engagement, Mark. The biannual membership survey response rate was up 3% compared to 2022. Respondent pool was more diverse and evenly distributed regarding age and number of years experience in scholarly communication than in previous years. Although a higher response rate is desirable,18% is within the generally acceptable range of 10-30% for external, voluntary, non-compensated questionnaires of this nature. Any survey is going to have some sample bias based on those who respond to it, and we did offer a caveat to that effect in the article.
In comparing the demographics of the respondents to the actual SSP member counts, it stands out that the 9% response rate of commercial publishers is substantially lower than their 21% representation in the SSP community. SSP conducts surveys at routine intervals directed at organizational members of which commercial publishers are a subset. The feedback is used to shape programs and activities important to organizational members.
It is worth noting that highly engaged individuals tend to take the time to fill out surveys, which you also observed from a different vantage point. One of the survey’s conclusions was a positive correlation between level of engagement and satisfaction with SSP. In that vein, one could view these results as a portrait of the highly engaged members of SSP.