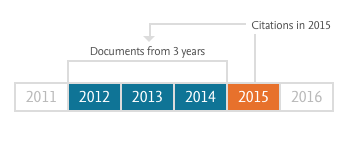
Calculating the number of journal papers that reach the top-cited 1% is more informative than the Impact Factor (IF), argue the editors of Nature Biomedical Engineering in an editorial, “Challenge the impact factor,” which was published on 11 July 2017.
Their alternative to the Impact Factor is a new index they call the “Impact Quotient” or IQ for short. Straightforward in its construction, the IQ is the percentage of a journal’s papers that reached the top 1% most-cited papers in the journal’s research area. There is a lot to like about a citation metric that is simple, intuitive, and can be explained in a single unqualified sentence.
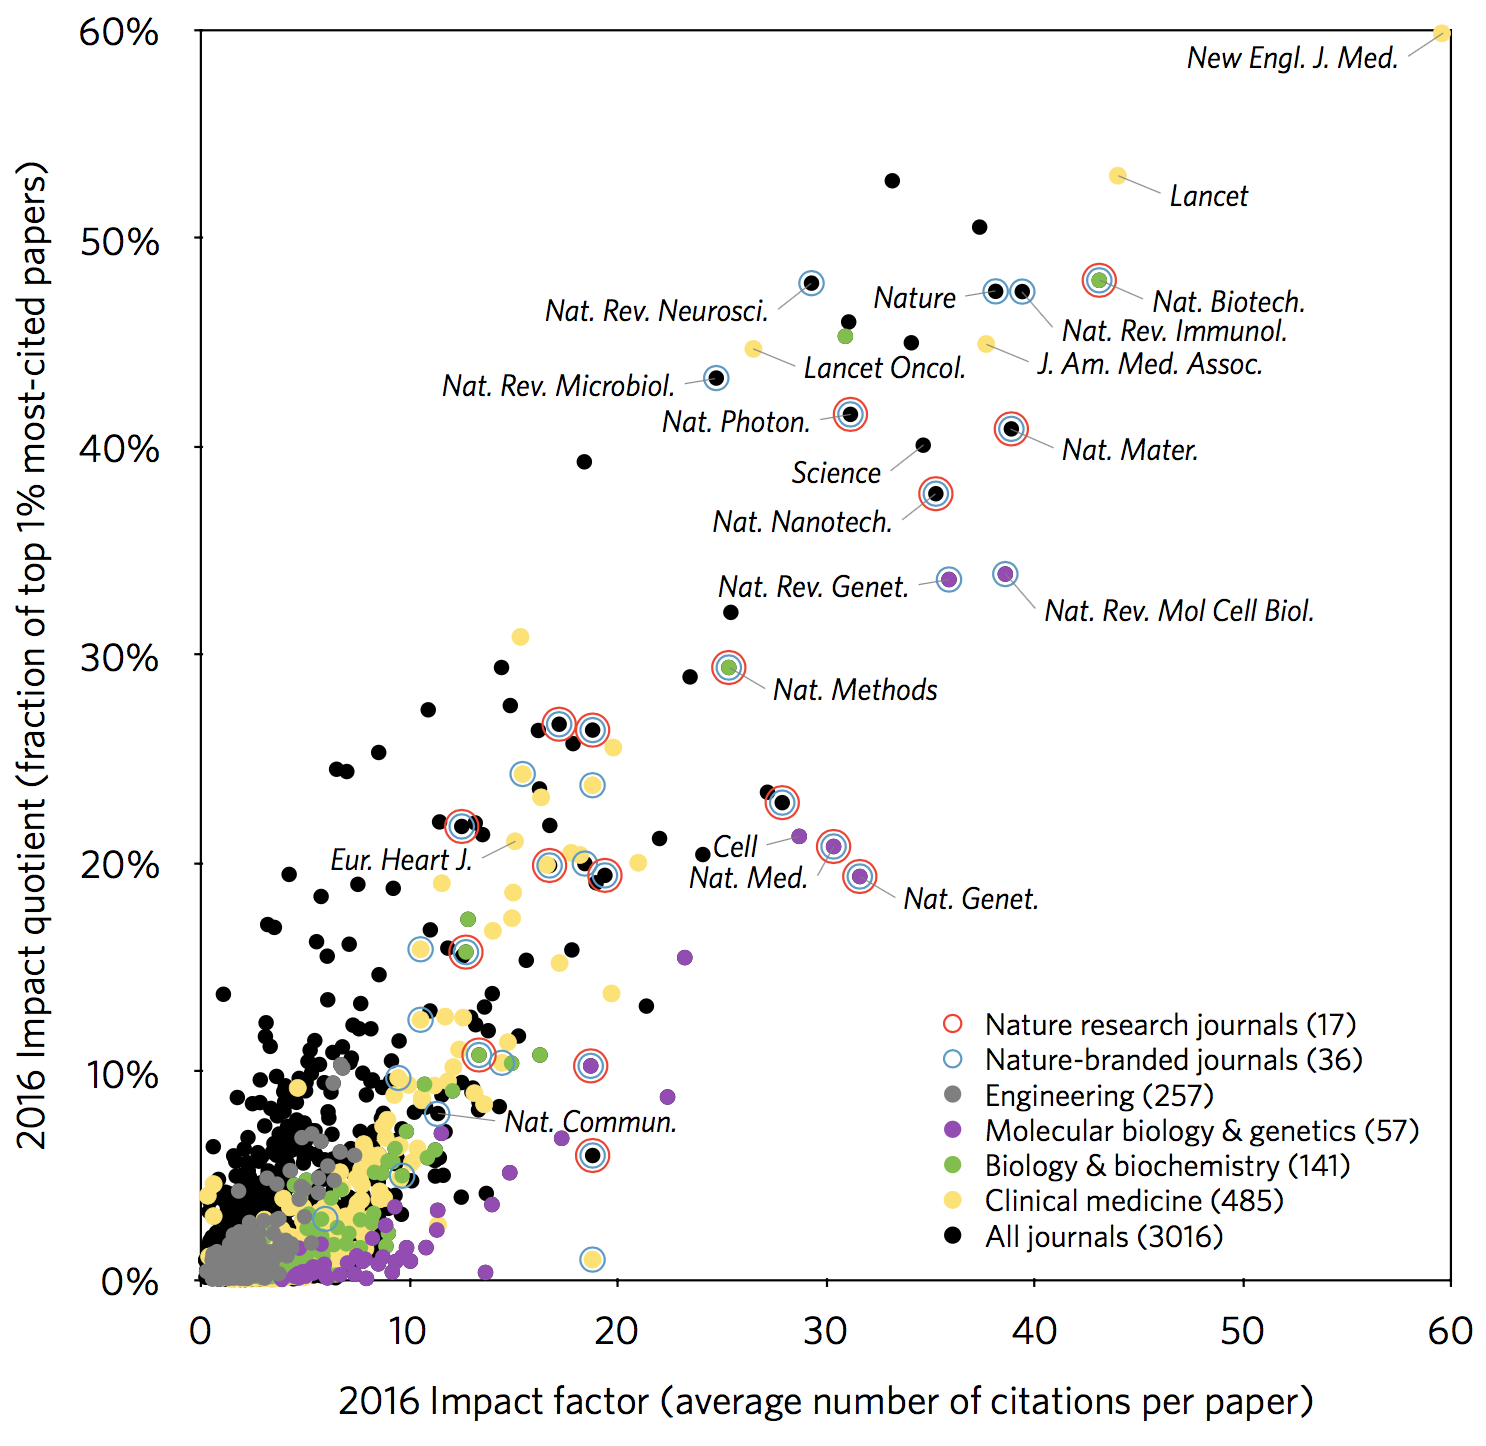
The editors’ figure, a scatterplot of IQ against Impact Factor reveals a correlation between the two measures for high performance journals. This is not altogether surprising as journals with high Impact Factor scores tend to publish a good number of highly cited papers.
But what about the bottom left corner of the plot where the vast majority of the journals in their dataset are found?
I investigated this for the field of microbiology for reasons that will make the methodology for calculating IQs much more complicated than reported in the editorial. The Essential Science Indicators (ESI) — the data source from which the editors extracted their list of highly-cited papers — is very different than the Journal Citation Report (JCR) — the source that reports Impact Factors. While both are produced by Clarivate, the former lists just 22 generic subject categories while the latter reports 236 specific subject categories. For example, there are 14 distinct engineering categories in the JCR but only 1 in the ESI.
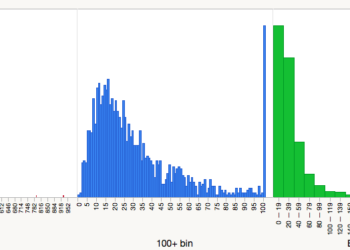
Even for Microbiology, in which both data sources list just one category, the journals are not the same. The ESI includes multidisciplinary science titles (Nature, Science, PNAS, Nature Communication, Scientific Reports, and PLOS ONE); the JCR does not. Remove these titles and just 72 (59%) of the 123 microbiology titles included in the JCR would get an IQ score above 0%. Put another way, 51 (41%) of the microbiology journals that received a 2016 Impact Factor would receive an IQ of exactly 0%.
Unsurprisingly, most of the highly cited papers were published in prestigious, high Impact Factor journals.
More importantly, of those 72 microbiology journals that would receive an IQ score above zero, 14 published just one highly cited paper and 8 published two. Unsurprisingly, most of the highly cited papers were published in prestigious, high Impact Factor journals, like Nature Reviews Microbiology (IF 26.819) and Cell Host & Microbe (IF 14.946).
For journals with Impact Factors smaller than 10, the editors claim that there is no correlation between IQ and IF, which, in theory has the potential of adding new information to the performance evaluation of a journal. However, the IQs of these journals are based on a very small number of papers that made it into the top-1% of their field. As a result, for all but a small group of elite journals, the one-percent club is a small numbers club, prone to chance and subject to wild fluctuations from year to year.
For all but a small group of elite journals, the one-percent club is a small numbers club, prone to chance and subject to wild fluctuations from year to year.
While I like the IQ in theory, in practice, it is unable to differentiate a large swath of research journals, is unable to distinguish performance among specialist fields, and for journals with IF>10, provides us with the same information as the Impact Factor. To me, the IQ is hardly an alternative to the Impact Factor. Nevertheless, it may serve as another performance data point that could be added to the JCR‘s panel of metrics.
It’s not hard to understand why Nature Biomedical Engineering editors like the IQ: Nature journals fare quite well in the index. Indeed, the editors highlight Nature journals in their plot.
For this reason, the IQ index reminds me of the Nature Index, a list of authors and institutions that have published in a set of 68 elite science journals, 17 of which are Nature journals.
In the end, we are left with an index, far more limited in scope, and unable to add any reliable information to what we already know: If you wish to read high impact papers, you are likely to find them in high impact journals.

Discussion
8 Thoughts on "The One-Percent Club For Top-Cited Papers"
Perhaps this is a response from Nature to Elsevier’s CiteScore metric, which deprecates the rating of many Nature journals due to their inclusion of editorial content.
Not one chemistry journal. I guess chemists don’t do citable research! How about a 1% by discipline! But, isn’t that what the JCR does?
Because those same journals aren’t competitive enough? HA! Your last sentence had me laughing–“If you wish to read high impact papers, you are likely to find them in high impact journals.” I could almost see you rolling your eyes and saying “thank gawd there are experts out there to explain these things to us!”
There is no a priori reason to focus on the top-1%, top-10%, or any other percentile class. One can use the quantile values of all papers in a journal and then integrate using Σi xi * n(xi), where xi denotes the quantile value i, and n the number of papers with this value.
A paper in the top-1% group then has a value of 99+ and a median paper will count as 50. See my paper: “Alternatives to the journal impact factor: I3 and the top-10% (or top-25%?) of the most-highly cited papers.” Scientometrics, 92(2), 355-365. We elaborated this for journals in: Leydesdorff, L., & Bornmann, L. (2012). “Percentile Ranks and the Integrated Impact Indicator (I3).” Journal of the American Society for Information Science and Technology, 63(9), 1901-1902.
Yes, you are right. The reason why I chose the top 1% most-cited papers is practical: Web of Science Core Collection provides them, according to 22 broad research areas. Calculating the top-X% most-cited papers for thousands of journals would be a tremendous involvement for anyone other than the owners of citation databases.
Disclosure: I am the author of the analysis and the editorial referred to in the post.
Hear, hear!
The discussion looks like little more than a sorry excuse for name dropping the journals in the lofty, upper right-hand echelons of Figure 1. A very small fraction of the total research output is published in these journals, so when constructing some journal index to model their impact, why even bother with trying to get a good description of them? Who cares if Lancet, JAMA or NEJM ends up highest? Any attempt at precision in their grading is a completely pointless exercise for everyone save a few editorial boards. A good start would be using a log-scale for the IF whenever it is plotted in a diagram.
I have added a log–log version of the same plot to figshare (https://doi.org/10.6084/m9.figshare.5248381.v3), in response to Torbjörn Björkman’s comment above.
The log–log version of the plot shows even more clearly that because the IQ is a measure of selectivity, for journals with IF < 10 the IF and journal selectivity do not correlate. For the vast majority of journals, IF is significantly affected by the citations to a really few highly cited papers. Because the IQ counts numbers of papers rather than citations to them, it greatly alleviates this problem.
However, IQ numbers for journals with a low IQ (< 1%) or for those with low output should not be compared, as the variability of the IQ over time can be substantial (yet still likely to be < 1%), owing to the low number of papers belonging to the top-1% most cited that were published by these journals. The point is that, for journals with low IQ values, the actual number doesn't really matter; such journals are not selective. Comparisons of IQ should be more meaningful for journals with IQ numbers above 1% and with a significant number of published papers per year.
Disclosure: I am the author of the analysis and the editorial referred to in the post.
I think that a formalized notion of “IQ” for a journal is actually worth considering. First of all, it pivots from individual subjective opinions held by each member of a field into something that could plausibly be more objective. It also makes it possible for people who don’t work in a field (or are newly entering it) to understand where to look for what the community as a whole finds interesting. Now whether this particular method of calculating IQ is appropriate is a completely separate issue. Clearly, such calculations can be skewed depending on how you define them and which journals you decide are relevant to a particular field. I’m not sure that the current “I know what I like” method is better.