In June, Clarivate (formerly Thomson Reuters) will release the Journal Citation Report (JCR), an annual summary of the citation performances of more than ten thousand academic journals. While the JCR includes a variety of benchmark performance indicators, most users are focused on just one metric — the Journal Impact Factor.
Designed as a tool for measuring and ranking the performance of journals within a field, the Impact Factor is now over 40 years old. In recent years, other citation-based metrics have been developed to complement, or compete with, the Impact Factor.

The purpose of this post is to provide a brief summary of the main citation indicators used today. It is not intended to be comprehensive, nor is it intended to opine on which indicator is best. It is geared for casual users of performance metrics and not bibliometricians. No indicator is perfect; the goal of the table below is simply to highlight their salient strengths and weaknesses.
These citation indicators are grouped based on the design of their algorithm: The first group (Ratio-based indicators) are built on the same model as the Impact Factor, by dividing citations counts by document counts. The second group (Portfolio-based indicators) calculates a score based on a ranked set of documents. The last group (Network-based indicators) seeks to measure influence within a larger citation network.
A good indicator simplifies the underlying data, is reliable in its reporting, provides transparency to the underlying data, and is difficult to game. Most importantly, a good indicator has a tight theoretical connection to the underlying construct it attempts to measure. Any one of these properties is deserving of its own blog post, if not an entire book chapter.
Last, any discussion of performance indicators invites strong opinions that are important, but largely tangential, to the metrics themselves, such as their misuse, abuse, social, cultural, and political implications. While these discussions are necessary, I’d like to keep comments focused on the indicators themselves: Did I miss (or misrepresent) any important indicators? Does one indicator capture the underlying value construct better than another? What would make an indicator more reliable, more transparent, or more difficult to game?
Ratio-based indicators
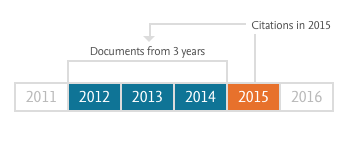
Impact Factor: Total citations in a given year to all papers published in the past 2 years divided by the total number of articles and reviews published in the past 2 years. PROS: Simple formula with historical data. CONS: 2-year publication window is too short for most journals; numerator includes citations to papers not counted in denominator. PRODUCER: Clarivate (formerly Thomson Reuters), published annually in June.
Impact Factor (5-yr): 5-year publication window instead of 2. PROS: Preferred metric in fields in which citation lifecycle is long, e.g., social sciences. PRODUCER: Clarivate, published annually in June.
CiteScore: Total citations in a given year to all documents published in past 3 years divided by the total number documents published in the past 3 years. PROS: Transparency (does not attempt to classify or limit by article type); based on broader Scopus dataset; free resource. CONS: Biased against journals that publish front matter (editorials, news, letters, etc.). PRODUCER: Elsevier, based on Scopus data, updated monthly.
Impact per Publication (IPP): Similar to Impact Factor with notable differences: 3-yr. publication window instead of 2; includes only citations to papers classified as article, conference paper, or review; based on broader Scopus dataset. PROS: Longer observation window; citations are limited to those documents counted in the denominator. CONS: Like the Impact Factor, defining correct article type can be problematic. PRODUCER: CWTS, Leiden University based on Scopus data, published each June.
Source-Normalized Impact per Paper (SNIP): Similar to IPP but citations scores are normalized to account for differences between scientific fields, where field is determined by the set of papers citing that journal. PROS: Can compare journal performance across fields. CONS: Normalization makes the indicator less transparent. PRODUCER: CWTS, Leiden University for Elsevier, published each June.
Portfolio-based indicators
h-index: A measure of the quantity and performance of an individual author. An author with an index of h will have published h papers, each of which has been cited at least h times. PROS: Measures career performance; not influenced by outliers (highly cited papers). CONS: Field-dependent; ignores author order; increases with author age and productivity; sensitive to self-citation and gaming, especially in Google Scholar. PRODUCER: First described by Hirsch, many sources calculate h-index values for individual authors.
h-5: A variation of the h-index that is limited to articles published in the last 5 years. Used by Google Scholar to compare journal performance. PROS: Enables newer journals to be compared with older journals. CONS: h-5 is biased toward larger titles. Google Scholar also reports h5-median, which is intended to address size bias. PRODUCER: Google Scholar. Published annually in June.
Network-based indicators
Eigenfactor: Measures the influence of a journal on an entire citation network. Calculation of scores is based on eigenvector centrality, computed through iterative weighting, such that citations from one journal have more influence than another. PROS: Offers a metric that more closely reflects scientific influence as a construct. CONS: Computationally complex, not easily replicable, and often provides the same result for most journals as more simple methods (e.g. Impact Factor). PRODUCER: Clarivate, published annually in June.
SCImago Journal Rank (SJR): Like Eigenfactor but computed upon the Scopus database. PRODUCER: SCImago for Elsevier, published annually in June. A detailed explanation and comparison of Eigenfactor and SJR is found here.
Relative Citation Ratio (RCR): A field-normalized citation metric for articles based on NIH’s PubMed database. A field is defined by the references in the articles co-cited with the paper of interest. For example, if Article A is co-cited by Articles B, C, and D, then Article A’s field is defined by the references contained within Articles B, C, and D. PROS: Allows each article to be defined by its own citation network rather than relying on external field classification. CONS: Sensitive to interdisciplinary citations and multidisciplinary journals. The RCR is dependent upon the Impact Factor for weighting journals listed in references. PRODUCER: NIH.
Discussion
22 Thoughts on "Citation Performance Indicators — A Very Short Introduction"
SNIP is produced by my center, CWTS at Leiden University, not by Elsevier. You state that “field classification is based on journal and may be somewhat arbitrary”. SNIP does not use a journal-based field classification (at least not in my understanding of this term). I would say that the main disadvantage of SNIP is the complexity of its calculation, making the indicator less transparent than many other indicators for journals.
METHOD-BASED OR THEORY-BASED
Once upon a time Lowry, who introduced a great method for measuring proteins, topped the SCI. Some opined that, since it supported a mere method-producer, this revealed a major SCI flaw. However, historians generally agree that the rate of scientific advance is sometimes due to an advance in methodology, and sometimes to theory. A methodical breakthrough allows the nimble and well-funded to pick a whole range of low-hanging apples with little thinking required. Lowry was quite modest about his protein assay. Some of those who, through application of new methods achieve high SCI ratings, are less so, and sometimes disparage those who introduce or test new theories. Alas, there is no index that discriminates between method-based and theory-based papers.
Phil, for the Impact Factor, you state that a “2-year publication window is too short for most journals”. This is indeed what many bibliometricians say. However, I don’t understand this point. Why is two years too short for most journals?
I’m not a bibliometrician, but here are my points:
1. The 2-year window based on the prior two years captures what Price called the “research front” in just a small set of prestigious titles. Garfield’s initial proposal for the SCI index (precursor to the Web of Science) was to include around 1,000 titles. (The WoS now indexes 11,000+ journals and strives to be broader in scope. Scopus attempts to be comprehensive with around 22,000 titles.)
2. For most journals, citations to papers peak after the Impact Factor window, often in the fourth or fifth year of publication.
3. Measuring impact so early in the citation lifecycle therefore is biased toward a small group of journals that focus on the research front.
4. Lastly, for journals whose papers receive few citations in years 2 and 3, the numerator of the Impact Factor is rather small and sensitive to small changes. A longer window would reduce that year-to-year variability.
The fact that JIF uses a window that is 2-years wide and 3-years old is neither a strength nor a weakness, but a definition of the calculation. Or, perhaps, I would say that whether that definition is a strength or weakness depends on what you hope to accomplish.
The brevity of the interval means it will precede the citation peak of most articles.
or
The brevity of the interval means it will be more responsive to new content in the journal.
Median age of cited works (Cited half-life) is a different measure – and there have been attempts to create a citation metric that incorporated this additional descriptor. This, too, is either strong or weak, depending on what you’re trying to do with it.
***
Phil – WoS covers far more than 11,000 titles.
*JCR metrics* are produced on 11,000+ journals – because JCR metrics are only produced on journals in SCI-E and SSCI – not on all WoS journals.
I don’t have at-hand the specific coverage counts on WoS Core Collection or WoS platform, but I know WoS will claim to be as broad as Scopus and Scopus will claim to be broader than WoS. Neither is “complete,” neither is all-inclusive, each has some the other doesn’t have.
I think the “numbers game” is less important at this point than the quality and profile of what is covered according to the region, subject, collection that you need to do what you need to do. Search, find, evaluate.
Thanks Marie. There is a lot of ambiguity about the size of the JCR dataset. On the first page of their Quick Reference Card, they state, “JCR citation data comes from over 10,500 journals…” They also refer to the Impact Factor as an “average,” a misnomer that you’ve attempted to clarify repeatedly.
I think the term “citation data” is ambiguous in that, in most parlance, people often refer to the metadata about an article, appearing in a database as a “citation,” e.g. a Medline citation.
The JCR “cited reference” data comes from SCIE, SSCI, AHCI, CPCI-Science, CPCI-Social Sciences & Humanities, and – as I learned recently – EsSCI. Just go to the (much-underappreciated) Cited Journal Data table on a JCR record – you’ll see proceedings and journals without a JIF listed as “citing journals.”
***
And, thank you for not making me do the “it’s a ratio” thing again.
Funny enough, some of the Elsevier info calls CiteScore a “ratio” – although they can claim the distinction of that ratio being a true average (within its methodological limitations).
There are some important differences underneath what seems like a minor semantic distinction. Again, I won’t say “weakness” or “strength” but only that the choice of whether to calculate a ratio or to calculate an average gets at the heart of what these two things measure and to something a bit more abstract about whether a “journal” is anything more than someone putting a bunch of items together in a pile.
I think that is another interesting angle to the lexicon of metrics you have here – which of them are actually JOURNAL metrics, and which are metrics that can be calculated on any collection of items? And…which of those measurement types do you want to use?
Thanks Phil for summarizing your points. Brief response to points 2, 3, and 4:
2. Bibliometricians indeed often claim that the peak should be included in the Impact Factor window, but I have never understood why the peak should be included. This is not clear to me.
3. The Impact Factor will always be ‘biased’ against certain journals, irrespective of the length of the publication window. So I don’t think this is an argument specifically against the use of a two-year window.
4. Whether the numerator is small depends primarily on the size of the journal. PLOS ONE doesn’t have a small numerator when a publication window of two years (or just one year!) is used. Other journals have a small numerator even when a publication window of five years is used. Again, I don’t think this is an argument specifically against the use of a two-year window.
I agree with Marie that whether the length of the publication window of the Impact Factor “is a strength or weakness depends on what you hope to accomplish”.
I think RCR is promising article-level metric, in principle.
But some of the calculation decisions Hutchins et al (http://journals.plos.org/plosbiology/article?id=10.1371/journal.pbio.1002541) decided to use are debatable, e.g.
– decision to use journal citation rates in the denominator, albeit via the co-citation network. I wonder if this really was due to “finite number effects” or just lack of article-level data, or to ease calculations.
– NIH PubMed citation data is very, very sparse for many fields, and consequently iCite implementation of RCR is useless for fields not covered sufficiently. I don’t know what fields it covers well, maybe medicine, or maybe just NIH-funded articles?
For example, I would be rather unhappy if a iCite was used in competitive assessment of my research, or comparing a Finnish ecology department to a US biomedical department: PubMed thinks my 10-year old ecology article has been cited 39 times (rate = 3.9/year), and iCite gives an average citation rate of 6.6/year – but Web of Science shows it has been cited 164 times (and Google Scholar shows cited by 231).
Another issue for any article-level citation count metrics is how to deal with synthesis and review articles. Those, like mine mentioned above, can become a boilerplate introduction-section citation for its field for a few years, and thus build a high count. But an article reporting groundbreaking results of an experiment in that same field could arguably be more valuable for science than that review, but the experiment can quickly fall from citations if it triggers an avalanche of follow-up experiments.
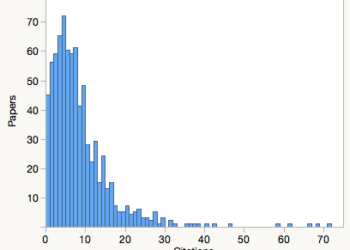
But with better data, and avoiding averages (citation counts are almost always both zero-inflated AND with long tails, so the distribution forbids using averages – medians or percentiles should be used instead) and avoiding using journal-level citation averages anywhere, RCR may be good for coming closer to apples-to-apples article-level comparison.
Ludo Waltman (Leiden Univ.) posted a useful critique of RCR and examples of how co-citation across fields alters a paper’s score, see: https://www.cwts.nl/blog?article=n-q2u294
Phil has included RCR in his overview of “the main citation indicators used today”. If this indicator is included, then I believe the standard field-normalized citation indicator should be included as well. Variants of this indicator are known under different names. Clarivate Analytics has labeled it ‘category normalized citation impact’ in its InCites tool. Elsevier calls it ‘field-weighted citation impact’ in Scopus and in its SciVal tool. In the bibliometric literature, the indicator is often referred to as the mean normalized citation score, abbreviated as MNCS. InCites and SciVal are widely used tools, so the use of variants of MNCS is widespread, much more widespread than the use of RCR.
I wish everyone was more transparent about what “field” means there. If I understand correctly, implementations of MNCS define a field based on journal categorizations, i.e. the target article is, in effect, compared to citation averages of a set of journals.
Averages! Journals! Neither belongs to article- or researcher-level citation impact analysis. (but I am not a bibliometrician, so what do I know)
Janne, there are different variants of MNCS. The most commonly used variants indeed define fields as categories of journals. However, more sophisticated variants define fields at the level of individual publication instead of journals. Of course, in the end, any definition of a field will be somewhat arbitrary and therefore somewhat unsatisfactory.
I agree with Janne, that RCR is very interesting “in principle,” but the details of scaling this up to a massive and evolving dataset, and spreading it out across fields where citation and co-citation networks are thinner, and use more diverse sources (not just journals, but proceedings or books, or primary sources) are the challenge.
My particular interest in RCR is as a student of Gene Garfield’s early work on citation indexing. One of the most critical ideas – way back in 1955 – was that the creation of a scholarly citation allowed one article’s content to be a descriptor of the other, a way to show the evolved meaning of the referenced article. That allowed the “indexing” of an item to evolve as the next generation of articles generated and evolving meaning.
RCR is the first metric I’ve seen that touches on that key idea from 60+ years ago. This could be, then, a test “at scale” of a foundational idea in information science.
Hi, just a quick note. Google Scholar’s h5-index is calculated for journals (all citations to articles published in the journal in the last 5 years), so I think the statement “Enables younger authors to be compared with older authors” doesn’t apply here.
Perhaps you’re referring to the h-index that is computed in Google Scholar profiles. In that case, however, that’s not the h5-index. In the profiles they compute the traditional h-index, and the h-index considering only citations made in the last 5 years to all documents in the profile.
Phil, Thank you very much for this useful overview of citation performance indicators. I would like to make one correction and one comment. The correction is that SCImago Journal Rank (SJR) is produced by the SCImago group based in Spain for Elsevier (like SNIP is produced by CWTS for Elsevier). The comment I would like to make is about the PROS for CiteScore. I think one of the most important advantages of CiteScore is its transparency. The database itself and the calculation including all documents and the citation counts are fully available for everyone to interrogate and verify.
Thanks, Wim. I’ll update the post.
Can you tell us how CiteScore classifies journals? I’ve seen some odd classifications, like a medical journal showing up under Ag & Bio, and a plant journal ranked in medicine.
Thank you for making the updates. The classification for CiteScore is the All Science Journal Classification (ASJC) scheme that is being used in Scopus. Classification is done manually by Elsevier staff. Indeed, the journal classification may not be 100% perfect. The feedback that we received after the original CiteScore release in December 2016 has been investigated and this will result in the correction of subject classifications for some 150 titles (the plant journal ranked in medicine that you indicated before is part of that). The corrections of the subject classification will become visible with the next annual release of the 2016 CiteScore values that will be released soon. More information on the classification of journals for CiteScore can be found here: https://journalmetrics.scopus.com/index.php/Faqs#faq-3-8
Phil, a deep analysis of the accuracy of the ASJC classification system used by Scopus, and also of the Web of Science classification system, can be found in the following paper: http://dx.doi.org/10.1016/j.joi.2016.02.003 (http://arxiv.org/abs/1511.00735). The paper presents a large-scale analysis that confirms your more anecdotal observations on questionable assignments of journals to categories in ASJC. I am happy to hear from Wim that some of the questionable assignments will be corrected.


