Which journal performed better in 2015: eLife or PLOS Biology? Most scientists and publishers would answer this question by looking up their reported Journal Impact Factor (JIF) scores. Others staunchly disagree.
In a recent paper posted to bioRxiv, Vincent Larivière, Associate Professor of Information Science at the University of Montreal, along with a group of distinguished science editors and publishers, argue that we are putting too much emphasis on this single summary statistic. Instead, we should focus our attention on the distribution of article citations within a journal, reminding ourselves that citation distributions are skewed, that every journal contains a small percentage of highly performing articles, and that these outliers can distort the average performance of a journal.
While Larivière concedes that these characteristics of citation distributions “are well known to bibliometricians and journal editors, they are not widely appreciated in the research community.” His solution to widespread ignorance is a histogram.
Simply adding a histogram isn’t going to reduce the misuse of the JIF.
Are scientists, librarians, and funders really ignorant about citation counts? Is there widespread misconception that if a paper was published in Nature (JIF=38.138), that every paper published therein received exactly 38.138 citations? Are the notions of uncited papers and highly-cited papers completely foreign to everyone but bibliometricians and journal editors? If you accept this tenet, then perhaps we all need a little more education.
Larivière and others are proposing that each journal calculate and display a histogram of their citation distribution to accompany the JIF. Most of his paper is devoted to screen shots of how to download citation data from various sources and create histograms using Excel.
Methods aside — most stand-alone and web-based statistics programs do a far better a job with creating histograms than Excel — Larivière argues that publishing the citation distribution “provides a healthy check on the misuse of JIFs by focusing attention on their spread and variation, rather than on single numbers that conceal these universal features and assume for themselves unwarranted precision and significance.”
Does a histogram really provide such a health check on JIF misuse?
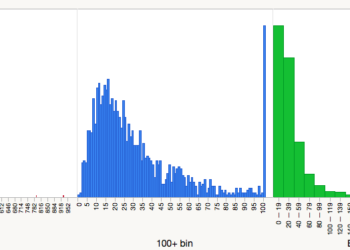
Consider the following two histograms, the top (blue) reports the citation distribution for eLife, and the bottom (green) for PLOS Biology. Which one is better? Squint your eyes, adjust your glasses. They look pretty similar, right? Or do they?
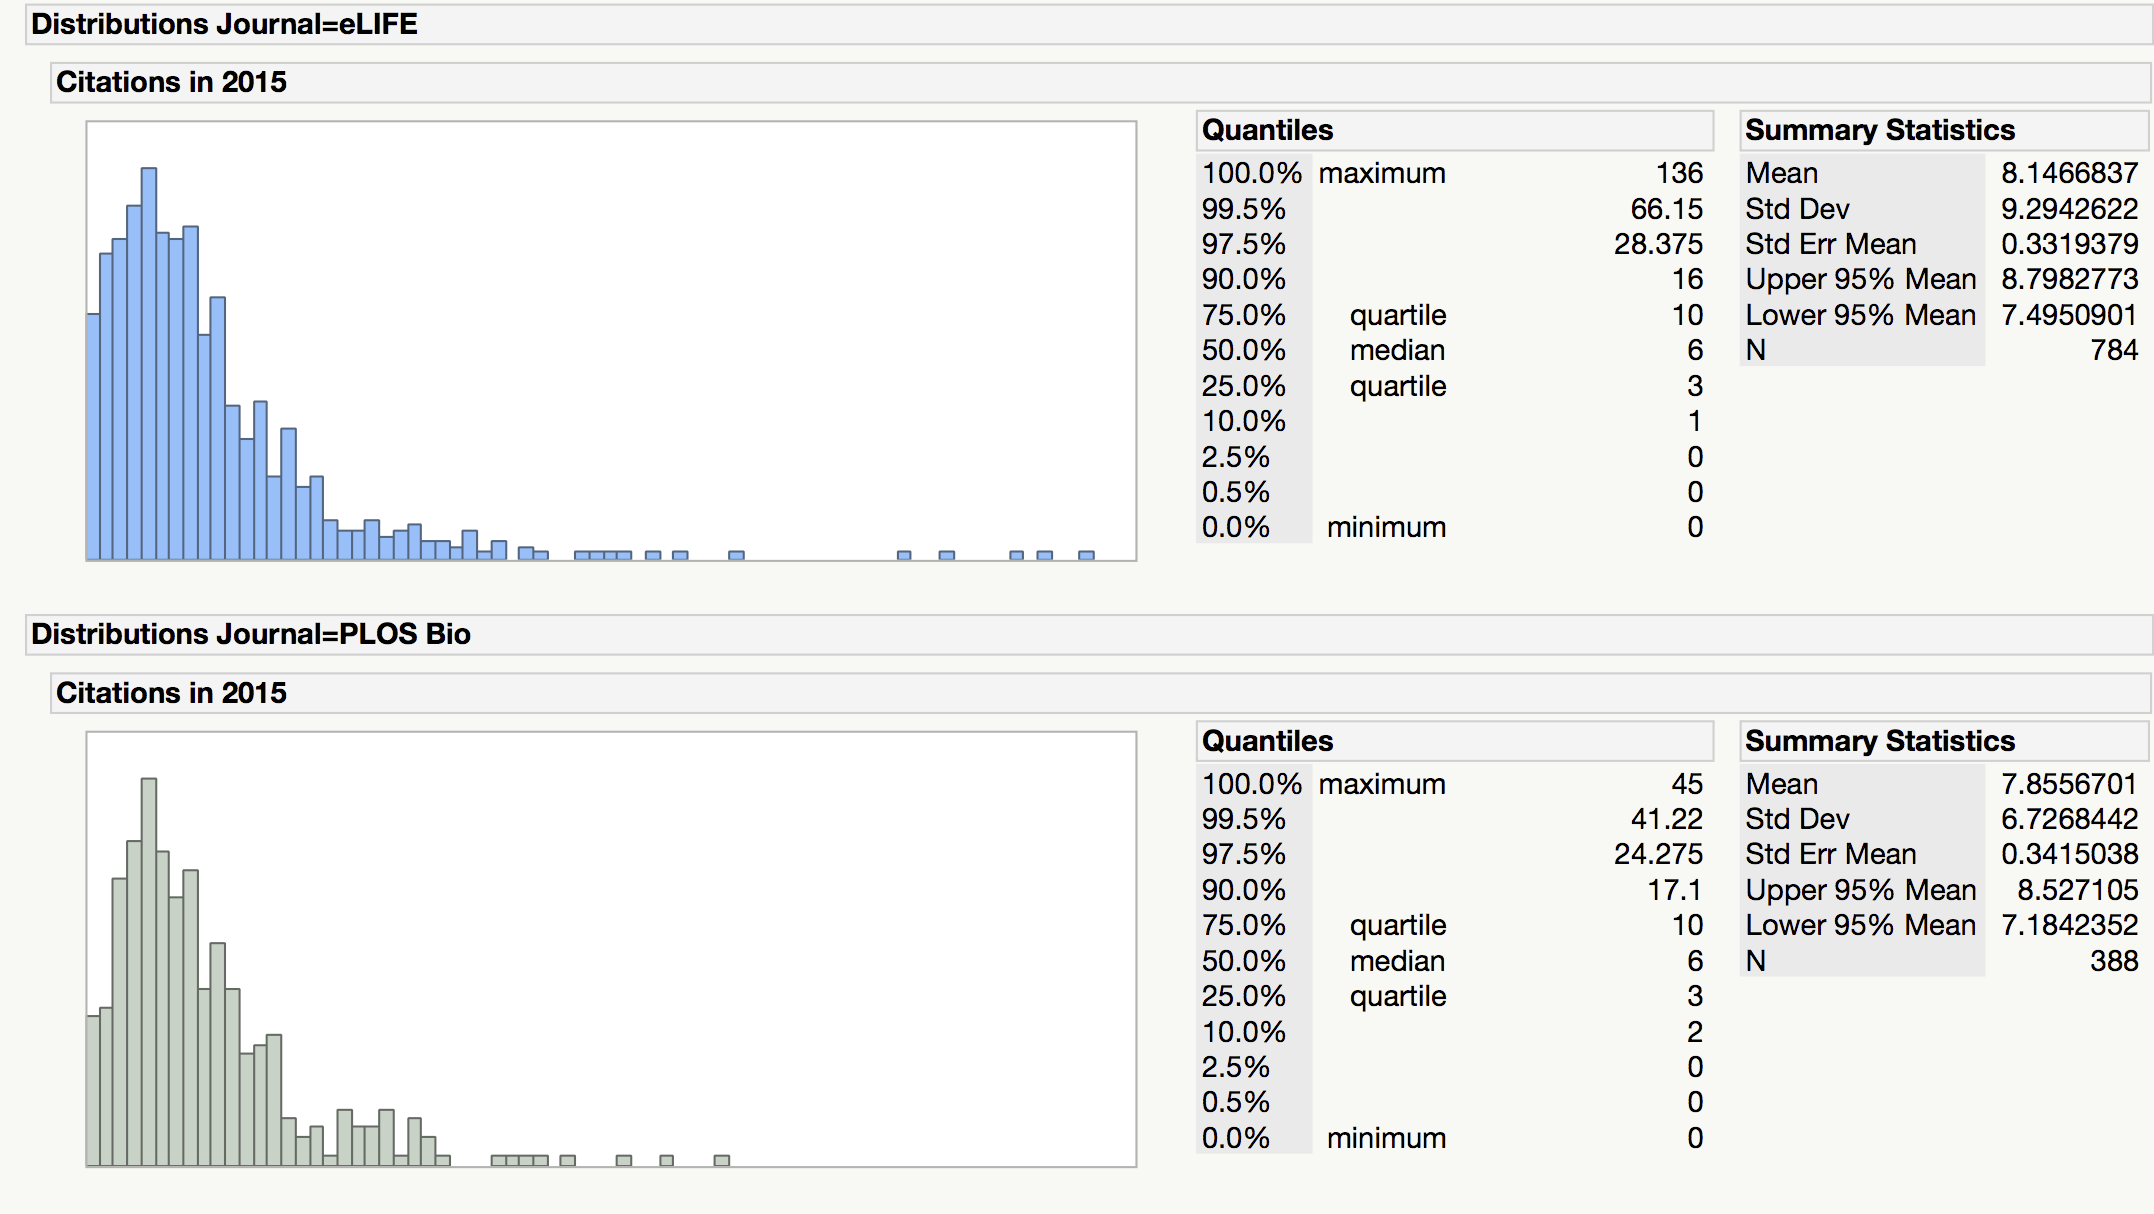
Their distributions are similar but not identical. You’ll note that eLife published many more uncited and low cited papers than PLOS Biology, but it also published many more highly cited papers. This is to be expected as eLife published twice as many papers in 2013 and 2014.
I’ve included summary statistics for these distributions. The mean (average) citation score for eLife was 8.147, compared to 7.856 for PLOS Biology. If our primary indicator is average article performance, eLife scored higher. Now, let’s compare other summary statistics:
The median citation score for each journal was 6 citations/paper, with the identical Interquartile Range (3 to 10 citations). By these measures, the journals perform the same.
If you do more elaborate statistical analysis and control for the date of publication of each paper (remember that we are measuring the performance of two full years of papers at a single point in time), the differences between these journals are insignificant. Statistically speaking, research and review papers published in these two journals performed about the same, which is the same information we got from their JIF with far less effort. Eyeball the other distributions that Larivière plots in his paper and you arrive at the same conclusion: Nature and Science have very different JIFs and citation distributions than PLOS ONE and Scientific Reports.
While it is clear that Larivière and his authors are not fond of the JIF, their alternative — showing all the data — does not adequately address their litany of criticisms.
Descriptive statistics (mean, median, percentiles, Interquartile Ranges, among others) were invented for the very purpose of summarizing data and allowing for their comparison, which is exactly what the JIF was designed to do. While it is clear that Larivière and his authors are not fond of the JIF, their alternative — showing all the data — does not adequately address their litany of criticisms.
If their primary complaint is about skewed distributions, then advocate for reporting median citation scores (understanding that it will result in a lot of ties, especially at the low end). If their issue is about the range of citation scores, report the Interquartile Range (IRQ). If their issue is about precision, then advocate for the reporting of the journal’s quartile or percentile. Readers who routinely use citation indexes will understand that these metrics are already available, although almost universally ignored.
This is not a problem about transparency; this is a problem about collectively agreeing upon an indicator that provides a fair comparison among groups of competing journals.
Simply adding a histogram isn’t going to reduce the misuse of the JIF. If anything, it will have us all squinting harder at our computer screens.

Discussion
19 Thoughts on "Will Citation Distributions Reduce Impact Factor Abuses?"
Parts of this blog post seem to result from a misreading of our paper and that appears to have led you to miss its more general point.
The post starts with a question about how to compare journals, but our paper does not address this question. It is focused on the widely understood problem of over-reliance on JIFs in research assessment, i.e. in evaluating the quality and contributions of individual papers and individual researchers.
You ask “Is there widespread misconception that if a paper was published in Nature (JIF=38.138), that every paper published therein received exactly 38.138 citations?” No-one would reasonably answer yes to a question framed in this way – and nor do we make any such assertion in our paper. But it is widely assumed that “publication in Nature” (for example) is accorded a score that weighs heavily in research assessment so, yes, people to tend to discount the real variation that is revealed by citation distributions. Our simple proposal aims to bring that variation closer to the surface, so that judgements are more likely to be made on what people have published, not where they have published it.
There are some oddities to in your re-presentation of our data. You replot the data for eLife and PLOS Biology and then ask “Which one is better? Squint your eyes, adjust your glasses. They look pretty similar, right?” Well yes, they do but mainly because you omitted to label the horizontal and vertical scales, thereby creating a bit of a straw man.
You also claim that a JIF of 8.1 for eLife makes it the “clear winner” over PLOS Biology, which has an impact factor of 7.9. But could I suggest that you look again at the standard deviations and standard error that you have calculated before making such an assertion. It is this kind of simplistic comparison that we are attempting to counter.
Where I agree with you is that it could be helpful to publish additional descriptors of the distributions (such as the median or interquartile range). Now that we have made the method widely available, I hope that more and more journals will make this information available alongside their distributions. i don’t think authors will object to having more information. But again the main point of our paper was to underscore that individual journal metrics cannot serve as reliable indicators of the quality of individual papers – even if they might produce some interesting signals that need to be followed up for verification.
I am not under any illusion that this preprint will by itself revolutionise research assessment. It is part of a broader assault on poor practice within the academy and scholarly communication. I am delighted that it has already won the support of several significant publishers, and I very much much hope that others will also embrace it positively. I think we all share the desire to see research assessment grounded in robust evidence.
I am delighted also that the preprint has already been downloaded over 6000 times and is being widely discussed. So my thanks also to you for writing about it.
Thanks for your feedback, Stephen. You underscore the very problem with citation distributions. Below, I have scaled eLife and PLOS Biology citation distributions so the Y-axes and X-axes are identical (BTW, the Y-axes in your paper vary, even for journals with similar distributions, like Science and Nature). The interpretation of which journal performs better changes dramatically under this presentation of the data. Unfortunately, your paper proposes no standard for histogram presentation, nor can we expect editors and publisher to adopt one. This leaves us with a very weak recommendation that encourages citation distortion.

It is certainly true that Figure 1 in our paper uses different scales. This was a compromise choice given the very different publishing volumes in our selection of journals, but the difference are clear from the axes labels. We wanted to focus on the shape and variation of the distributions; details are discussed in the text. Moreover, readers should feel free to re-plot the data in new and interesting ways (with a common Y-axis if so desired) since we have made them available as one of the supplementary files that accompanies our preprint. I don’t see how we are encouraging citation distortion. I think it’s clear that we want to bring more information to the question of examining the worth of individual papers and these distributions provide useful context not available from the JIF.
Phil, we all know what statistics are for and I am not quite sure why this was interpreted as a call to avoid using statistics.To reiterate Stephen’s point and as clearly stated in the abstract of the preprint, the point is transparency – just looking at the distributions instead of a single number alerts even the most casual observer to the fact that a specific paper could fall anywhere on the distribution. This is important as discussed elsewhere on this thread: most people (scientists and administrators alike) are not really engaged in these debates, so we need a visually intuitive way to make the point. This is the only way to try to change behaviour – not overnight of course.
Median, Quartiles and collapsing journal rankings: the point has been made loud and clearly elsewhere (e.g. http://www.ascb.org/dora/). At EMBO Press, we actually also like to report all the other journal metrics available side by side – this is a great way to show the limited correlation between journal metrics.
Thanks for your response, Bernd.
I understand that your call is for transparency, and I made this clear in the concluding argument in my post. I do, however, disagree that transparency—especially in the form of a histogram—is going to reduce the misuse of the JIF. Histograms axes can be stretched and pulled, arbitrarily cut off, and numbers can be binned in such a way to make any point the editor or publisher wishes to make. You can’t distort the average 8.123 or the median 6, or the range 2-10.
I agree, but this initiative is still squarely aimed at those misusing these metrics for comparing individual papers/individuals. For journal comparisons a single number will continue to be way more enticing than superimposing distributions (in this respect it may in fact be useful not to adopt a homogenous standard).
Regarding journals: JIF to 3 decimal places cannot be distorted, but it is highly distorting in creating journal ranking based on noise (a single citation to a single paper can change journal rank). This is in fact why ISI also prefers the mean: the median collapses journal ranks.
Reporting median and quartiles: good idea as a standard – we did do that in the original editorial: The EMBO Journal (2015) 34, 1601-1602 http://emboj.embopress.org/content/34/12/1601
bioRxiv allows revised versions of manuscripts to be posted. Perhaps the medians and interquartile ranges, along with pre-normalized versions of the distributions with the same y-axis scale, could be included in a revised version of the preprint, along with a call for these to be promoted too.
Stephen, regarding this statement: “But again the main point of our paper was to underscore that individual journal metrics cannot serve as reliable indicators of the quality of individual papers – even if they might produce some interesting signals that need to be followed up for verification.”
I disagree strongly, so I disagree with the main point of your paper. One of the primary functions of the system of journals (as opposed to individual journals) is to rank papers by accepting or rejecting them, often on quality grounds. The JIF captures this feature fairly well. Thus journal metrics serve reliably well as indicators of the quality of individual papers. That is, in the higher ranking journals there is severe competition for publication, so the accepted papers are judged to be of high quality.
In this competitive context the statistical refinements you describe seem to me to be of relatively little importance.
I think you raise an interesting point here–what it means to be published in a prestigious journal compared with what it means to be highly cited. These are not necessarily the same thing. I agree that because of the increased competition for being published in prestigious journals, accepted manuscripts may be of higher quality than rejected manuscripts (as perceived by reviewers and editors). This is why university administrators may gauge their researchers’ performance by how many papers they have published in Q1 journals that year. They understand that waiting to evaluate researcher performance based on citations received by those papers take too long for yearly evaluations.
By contrast, citations is more related to impact/influence. Although quality of the article is certainly correlated with its impact, publishing in the right journal to reach the right audience (not necessarily the most prestigious journal) is as important. So is post-publication promotion at conferences, networking, online, etc. The more people know about your published paper, the greater the chance they will read it, which may then influence its citation rate.
So while there certainly is a relationship between quality and impact, they are distinct factors. That’s the confusion about the JIF. It’s actually related to impact/influence as it is measuring average citation rates for the journal. However, because higher JIF journals generally can be more selective and may then publish higher quality papers, people then mistakenly use JIF as a proxy for quality. And this is what I think people should be careful of.
I’m afraid we disagree (strongly) and the evidence, some of it dating back to 1989 (see http://www.ncbi.nlm.nih.gov/pubmed?Db=pubmed&Cmd=Retrieve&list_uids=2799903&dopt=abstractplus), does not support your contention that JIFs capture paper rankings “fairly well”. We don’t dispute that JIFs carry some information, especially when there are large differences between them, but it is the unthinking over-reliance on JIFs that is problematic. In my view the publication of citation distributions serves as a useful corrective to that tendency.
It is always amusing to read these discussions as I believe that 99% of the audience is lost with the discussion in the first place. Most of the publishers with the high or highest impact factor journals usually just ignore all of this discussion and the papers, tenure, and new grants flow from/ to the researchers at the top of the impact factor. The publishers at the bottom of the scale always point to this research and make the claim that their articles are really great research just overlooked. And the fun continues. For 40 years or more the Impact Factor is still king of the hill.
As we have articulated over and over in the San francisco declaration (http://www.ascb.org/dora/ ) the whole research evaluation ecosystem has to change – DORA was actually meant to indicate that it is not generally the high JIF journals per se that are promulgating this system, nor is it low JIF journals that try to destroy it because they are feel hard done by – research itself is skewed by oversimplistic but dominant measure like JIF – this is bad for science.
You will see that DORA is signed by many high JIF journals (in fact a number of them were part of the launch group) and you will note that this preprint article counts among its authors also representative from high JIF journals.
Maybe something is changing after 40 years. High time too.
Ideally we’d have access to the raw unbinned citation counts per paper in machine readable format. If that’s not possible, the histogram only allows eyeballing – not very sophisticated statistical inference. More diverse summary statistics would be something more pratical. (And I’d advocate for the log-normal mean and standard deviation, to get rid of the skewness, and allow asymmetrical lower/upper bounds.). The main point is the need for errorbars, an uncertainty interval around the expected citations-per-paper. Without it, we can’t find out the strength of the evidence in statements such as “The mean (average) citation score for eLife was 8.147, compared to 7.856 for PLOS Biology. If our primary indicator is average article performance, eLife is the clear winner.” More statistics would also avoid exaggerated claims such as these. A little more statistical rigor would also minimize exaggerated claims such as that the JIF is meaningless.
The analysis is interesting. People who want one number indicator will always prefer one number indicator. People who read articles would not care. But one can clearly see that one of the journals attracts more authors who don’t know the value of there work. It looks as it is the free one. The for gold one has more pragmatic clientele.
The authors knows of course that their paper does better than the journal on average, but this analysis shows how many such underperformers are there. Look, we have quite a company.
How comes that every paper was quoted at least once? Probably I did not understand that part. Or, is there a mechanism, an editorial or a rewiew that provides a service? I ask this because an editor asked me as a favor to write a brief summary on my paper to include in an editorial. That is a sure citation of course.
If the problem is that journal-level metrics ought not be used when the question is paper-level or author-level performance … why tinker with journal-level metrics at all? Even if the journal metric were improved or enlarged to show detail or whatever, wouldn’t it remain just as problematic as before to assess a particular paper or a particular author using this metric? If the status quo is: conflating a monolithic aggregate number (JIF) with one of the components that went into calculating the aggregate (a single paper) … then, under the histogram regime, the same sin would seem to be committed. It is just that the aggregate data is more complex (a distribution and its mean, rather than the mean all by itself). But the added complexity doesn’t get us any closer to addressing the question of: how did a particular paper X or a particular Professor Y perform. Right? Instead it refocuses our attention on the aggregate, fleshing it out a bit. Or am I missing something?
We on PSP’s Committee for Digital Innovation were excited to see this new paper by Larivière et al., and we are delighted to see the conversation over it continue here on The Scholarly Kitchen. Serious discussion of Journal Impact Factor and the various alternative metrics for assessing the influence of published research is a healthy, necessary development, and all of us involved in scholarly research should feel our real stake in the outcomes.
Anyone interested in learning more or participating in that discussion might find it useful to join us for the series of three lunchtime seminars on this topic that the PSP Committee for Digital Innovation will be sponsoring this fall on Sept. 22, Oct. 19, and Nov. 16. Among the many themes that will be explored are the history and ongoing evolution of JIF, a look at some of the existing and proposed alt-metrics, and the consequences of these various systems for scholars, research institutions, funding, and publishers. For more information about the seminar series as it continues to take shape, please contact Sara Pinto at spinto@publishers.org and she will place you on a mailing list for updates.