Today’s post is co-authored by Lisa Janicke Hinchliffe (Chef) and Christine Wolff-Eisenberg (Manager, Surveys and Research, Ithaka S+R).
As higher education institutions in the United States began to respond to the COVID-19 pandemic by moving classes online, emptying residence halls, and authorizing remote work, academic librarians found themselves in need of real-time information — not only about their own institution’s practices, but also how other libraries were responding. On March 11 at 9:39 AM ET, Christine asked:
“Is anyone working on a spreadsheet (or other systematic data collection method) of how ACADEMIC LIBRARIES are staying open, closing, or reducing in-person hours/services in light of parent institutions moving to online-only instruction?” (https://twitter.com/cwolffeisenberg/status/1237735008934211584)
Lisa replied that she had checked and had not been able to find anything. At 10:07 AM, we had our first phone call to discuss what could be done. In the next 13 minutes, we mapped out a plan and … the rest is now (very recent) history.
In this posting, we’ll share the story of how we developed the survey to collect both initial and updated reports from academic libraries, which we deployed that evening at 7:51 PM:
“ACADEMIC LIBRARIANS: @cwolffeisenberg + @lisalibrarian are gathering information on academic libraries in the United States and the response to COVID19. Please take a few minutes to fill out the survey for your library → https://surveys.ithaka.org/jfe/form/SV_8qN8F2274hMBBBz #CovidLibrary #CovidCampus” (https://twitter.com/lisalibrarian/status/1237888891299876864).
We hope that this serves as a useful case study for those who are also finding themselves in situations where speed in gathering and disseminating useful information is the most important objective.
In addition to the survey itself, we also built out real-time dissemination of the results and the beginnings of a communications strategy. Since then, the project has grown significantly to include published analyses of the data, additional reports and dashboards, a geographic visualization of building closures by Cal Mugru, scraping of Twitter to create an archive of related tweets, and a fair bit of media coverage. And, in keeping with the overall theme of continuously improving our efforts, at some point along the way, we realized a portal page with a simple URL would be useful! See: https://tinyurl.com/covidlibrary for the survey, live dashboards, analyses, and media coverage as well as links to data collection projects for public libraries in the United States as well as projects going on in other countries.
To our knowledge, this is the most comprehensive dataset of not only the status of U.S. academic libraries, but also of which institutions have moved their courses online and which have vacated their residential facilities.
We want to thank everyone who filled out the survey (sometimes multiple times — and, yes, we are still collecting first and updated status reports from any academic library in the United States, so keep the responses coming!), helped to amplify the project on social media and library listservs, and suggested additional live data dashboards. Though we built the infrastructures, the data everyone contributed are what made it possible for this project to serve the community.
Survey Development and Deployment
In the span of approximately ten hours, we went from survey development to deployment. First, literature on library responses to crises and disruptions was consulted. Unfortunately, the majority of the literature seemed to be about recovery of damaged materials from flooding, fires, etc., rather than continuity of services. However, “In Case of Emergencies: Continuity of Operations (COOP) Planning” from the National Library of Medicine provided insight into what libraries might consider “mission essential functions” in times of crisis and strategies for continuity. We also drew on our general knowledge of core user services and the things that librarians were starting to ask about on Twitter and listservs. From this information base, the basic components of the survey — the questions and answer options — were drafted. Once the draft was completed, we posted a link to a Google Doc on Twitter and solicited the library community to conduct self-paced cognitive walk-throughs of the questions and to give us feedback over the course of about 90 minutes. Lastly, after we programmed the survey in Qualtrics, we solicited pre-testers on Twitter; in under an hour, nine individuals took the survey from start to finish and provided feedback on the user experience. At each stage, we used the feedback to revise and refine the survey instrument as the feedback process was progressing.
While there are perhaps some small elements of the survey that in retrospect we might have designed differently, many of the decisions we made that day were ones that we would very much recommend others employ as well. These strategies include:
- Keep It Short and Simple: Recognizing that time and resources are currently very constrained, we aimed to construct a survey that could be easily completed in under five minutes.
- Embed Unique Identifiers: By asking respondents to include their institution’s IPEDS UnitID, we will later be able to pull in all kinds of additional variables, including geographic location, institution size, and sector. This also made it easier to create certain library data dashboards.
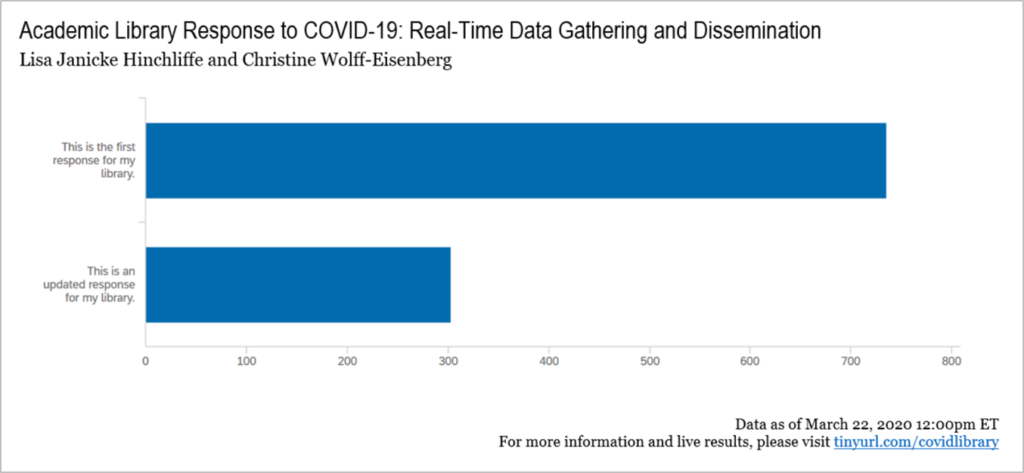
- Allow Retaking: Given the rapidly changing policies and practices in and beyond the higher education sector, we intentionally designed the survey to be taken multiple times by a library representative when changes occurred. We asked respondents to indicate early on in the survey whether it is their first response or an update, also allowing us to map changes over time within a single institution.
- Provide Results Immediately: Often with a research project, the results are not available for weeks, months, or even years after data collection. In this case, having results continuously and immediately available to respondents was critical for ongoing decision making.
While best practices for survey design and distribution generally entail having contact information for a pre-defined population or sample, in this case we naturally did not have time to generate such a list. Instead, we employed all of the other outreach strategies at our disposal, including Twitter, listservs, and personal relationships with individuals, association leaders, and media contacts. We also established #CovidLibrary as a hashtag in our earliest tweets. Despite this more organic approach to soliciting participation, we have been able to garner nearly a 20% response rate for not-for-profit higher education institutions across the country. This is quite a feat given the non-targeted outreach approaches utilized. We are hopeful of that, as responses continue to come in, we will have a dataset of at least 25% of these institutions.
Communicating Results and Tracking Impact
At the time of launching the survey, we had created one dashboard of results to display all aggregate results in real time. Since then, we have built out half a dozen — some specifically for subsets of institutions (e.g., non-residential institutions [roughly mapping to community colleges though not exclusively] and U.S. members of the Association of Research Libraries) — and others to display results broken out by certain variables in the report (e.g., institutions that have moved classes online and libraries that have closed their physical locations). These different manipulations of the results were made possible due to the presence of the unique institutional identifier (IPEDS UnitID), along with a few reporting features in the Qualtrics platform, like filtering (which limit results displayed) and “breakouts” (which stratify results). We created many of our dashboards of particular result sets in response to requests from specific individuals but then have shared them and seen them used in a variety of other settings.
At this point, we have heard from many dozens of individuals who have used the survey results as they have come in. The comments below — which at times have been shortened for length or lightly edited for clarity — illustrate the planning and advocacy steps taken.
- “The survey instrument can be used to help plan your library’s response.”
- “It was immensely helpful in putting together our service plan today.”
- “This has helped us immensely to make the case for our own eventual building closing.”
- “The data of yours that people are using to get their libraries to close are going to save lives.”
- “My thanks for all the work you are doing. It is essential for so many of us. Part of the reason we were able to move at such a pace was due to it.”
These messages, along with copious cups of coffee and tea, have fueled us continuing this work — at all hours of the day and night — over the past two weeks.
Managing the Project Collaboratively
To say that the two of us have stayed in very close contact over the past two weeks would be a tremendous understatement. To do so, we have employed a variety of modes and technologies including e-mail, telephone, Twitter direct messaging, and eventually a guest account for Lisa on the ITHAKA Slack instance. We have relied on these communications technologies, as well as Qualtrics, Google Docs, Sheets, and Drive, and Microsoft Excel and Word, for the success of this project.
More importantly, however, are the conditions — beyond the technologies — that make this work. At the foundation is the fact that we already had an established working relationship and high levels of mutual trust and respect. We have partnered together on a number of projects, many of them focused on user surveys and reporting out data, that involved working collaboratively at a distance. We could quickly ramp up for this project because we already had knowledge of our respective working styles, skills, strengths, and weaknesses.
Though this list is likely not comprehensive, we have reflected on the strategies that allowed us to be both effective and efficient under the time pressures of this project. Our collaborative practices include:
- Holding Regular Check-Ins: Each day we had at least one or more conversations about how things were progressing, pending decisions, next steps, etc. We also took time to check in on a personal level, as this project has been very emotionally taxing at times, especially as we both transitioned to “work at home” while it was getting underway. In between telephone calls, we relied on our “What We Did” Google Doc to document our work and also “park” items for our next conversation.
- Committing to Decisions: With the fast pace of this project, extended deliberations on any particular topic or question were not possible. We developed a practice of explicitly stating the stages of decision making as we worked through them: exploring options, selecting an option, expressing commitment, and identifying who was responsible for implementation. While we could revisit a decision if a problem arose, it was clear that we would not backtrack unless it was absolutely necessary.
- Acting Independently. Having established robust communications and decision making strategies, each of us could also act independently and respond to queries, update files, etc. as needed, confident that our individual decisions were aligned with each other. This confidence to act independently allowed us to work on different tasks simultaneously and achieve high levels of efficiency.
- Incorporating Other Perspectives. Though our partnership is two people, we also prioritized gathering and incorporating feedback from others. This not only included gathering input on the survey instrument while it was being developed, but also means that when we get a question about the results, we not only answer but also use it as an opportunity to see if we can improve the reports themselves.
- Seeking Support. Along the way, we have needed help. Colleagues at Ithaka S+R — Kimberly Lutz and Roger Schonfeld, in particular — have been instrumental in providing guidance and ensuring prompt processing of our analyses for posting to the Ithaka S+R blog platform. A number of people have assisted in helping set up tweet scraping (for now we are just capturing the tweets related to this project). Organizations such as Achieving the Dream, the Association of College and Research Libraries, the American Library Association, the Association of Research Libraries, NISO, the Society for Scholarly Publishing, and many more have promoted the survey and helped to disseminate the results. (It makes us nervous to make this list as we no doubt have overlooked someone! Please know we are grateful to you all!)
Future Plans
We have been asked multiple times how long we will keep the survey live and collecting data. Our answer is that we will do so as long as the data coming in continue to be useful to the community. We suspect that means at least another week or two as the impact of the crisis is hitting different parts of the United States at different times. There are some institutions and libraries where this is only now becoming a focus. In addition, as institutions continue to evolve their strategies, libraries must as well. There may be a second and a third and a fourth round of decisions still to come. This is why it has been really important that we built in the mechanism and encouraged librarians to come back and engage with the survey again so we can track those changes over time.
We are confident that we will eventually publish some sort kind of capstone report at the end of all of this. This is a very rich dataset and analyzing it in greater detail than we can on a real-time basis will be of great benefit to the academic library community. We know that we also want to investigate how people used the data in their decision making and advocacy work locally. Deciding how we approach our future analysis, if we will seek additional partners when doing so, whether we will seek grant funding to support it, etc. — these are all questions on our “to do later” list. For now, we remain relentlessly focused on gathering and disseminating in real-time the data from and for our U.S. academic library community as we respond to the COVID-19 pandemic.


Discussion
1 Thought on "Academic Library Response to COVID-19: Real-Time Data Gathering and Dissemination "
Thank you for sharing this information.