Editor’s note: Today’s post is by Iain Hrynaszkiewicz. Iain is Director, Open Research Solutions at the Public Library of Science (PLOS).
Research suggests that the kinds of “innovation” – and Open Science is still often labeled as such – that stick at large commercial academic publishers are the innovations that tend to achieve at least one of three things: Increases in revenue; reductions in costs; improvements to reputation. Given the challenges of business models for Open Science, and the additional burdens on workflows new or experimental policies and solutions can create, one can see how prioritizing Open Science initiatives, when faced with a large backlog at some organizations, could be challenging in the short term. However, Open Science is increasingly correlated with trustworthy and impactful science, underscoring that intelligent openness should, in fact, be seen as a matter of reputation.
But a further challenge remains. If the success of an innovation relates to the practice of Open Science – which at PLOS is about much more than reputation; it’s central to our mission – then what does success look like? And how do you measure it at the publisher scale? Indeed, to make progress towards any goal, good data are needed, including a view of your current and desired future states. Unfortunately, as recently as last year, there were no tools or services that could tell us everything we wanted to know, at PLOS, about Open Science practices. Benefits of Open Science – economic, societal, research impact and for researcher careers – are often highlighted, and to deliver these long-term benefits, measurably increasing adoption of Open Science practices is a prerequisite goal.
Principles and requirements
This is, in part, why we developed and have recently shared the initial results of our ‘Open Science Indicators’ initiative. We piloted a new way of measuring code sharing in the computational biology community in late 2021, and have since needed to scale – to more research communities and research outputs. In consultation with our Scientific Advisory Council we defined overarching principles and requirements for a broader set of Open Science Indicators that could be measured across multiple publishers’ content. PLOS then selected DataSeer as a partner to implement a solution following a Request for Proposals (RFP).
What are the overarching principles we established? (paraphrased here):
- Align with established community definitions or approaches wherever possible
- Measure what practices are being carried out now
- Ensure interoperability across diverse communities
- Be scale-able across large volumes of research outputs
- Share results of Open Science Indicators/ monitoring activities openly
- Use Open Science Indicators responsibly
What do these principles look like in practice?
- We used the FAIR principles and MDAR framework to help determine what we would like to know about research practices or outputs (data, code, preprints, protocols, etc) – to measure and understand trends.
- While the intention is to identify and celebrate good practices, we have taken an inclusive view of sharing practices that may not be considered FAIR-compliant. This includes measuring outputs shared via Supporting Information (a practice often criticized by open advocates because these files are less findable and accessible than content in dedicated repositories, but which nevertheless appears to meet many researchers needs, at least from their perspective)
- We are capturing information that helps us begin to understand aspects of diversity – geographic and subject area – and information that points to community specific practices, such as infrastructure names and types.
- We’re not the first to try and measure Open Science – there is a growing community of tool developers and meta-researchers that have inspired us – but we might be the first publisher to attempt this at this scale, making natural language processing and artificial intelligence a logical part of the solution.
- The dataset is available publicly. There are numerous ways to analyze and segment the data, and we welcome feedback on the approach we have taken so far, and suggestions for alternative approaches.
- We have chosen not to include Journal or Institution names in the public dataset, as these could potentially help facilitate rankings of these entities, and we have so far reported results at a PLOS-wide aggregate, and comparator cohort, level.
These principles and requirements have latterly formed a timely contribution to UNESCO’s Working Group on Open Science Monitoring Frameworks.
Initial results and a call for feedback
The first dataset analyzes research articles published between the start of 2019 and the end of Q2 2022 (~61,000 PLOS research articles). A comparator set of publicly-available research articles (~6000, or about 10% of the PLOS sample) has also been analyzed to put the findings into context. Additional indicators and further data analysis on articles published from Q3 2022 onwards will follow in 2023.
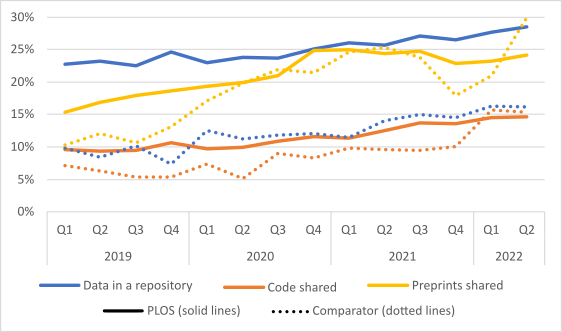
Importantly, the approach we are taking can provide information on the prevalence (observed sharing rates) of Open Science practices and the potential for adoption of those practices. For example, while all research articles could potentially share a preprint, only some research articles generate code (in case you’re wondering, we now know that just over half of studies published in PLOS journals generate or use code that could potentially be shared).
The initial results are encouraging in many ways – trends are upwards for PLOS and non-PLOS articles – but our interpretation of them at this point is minimal and cautious. We first have important questions to ask the community about the approach we are taking to this “measurement problem”. Although we’re keen to share our experiences, we don’t claim to have created an Open Science monitoring standard to be readily adopted. There are numerous developments across scholarly publishing that should lead to increased adoption of Open Science practices, and more will undoubtedly be incentivized by the Nelson Memo and Implementation of UNESCO Open Science Recommendation. Examples include Springer Nature’s roll out of integrated data sharing services; GigaScience Press’ requirements for protocol, code, and data sharing to support reproducibility, and eLife’s shift towards a preprints-first model. Funders and institutions are also innovating, such as Aligning Science Against Parkinson’s stringent open science requirements, and the researchers-led (“grass roots”) activities of the International Reproducibility Networks.
Given this diversity of activity that appears to have a common desired outcome there is a need to start a conversation – a conversation about how we can use better quantitative, longitudinal evidence on if and how open science practices are being adopted. Ideally, this quantitative evidence would be combined with qualitative (such as survey) evidence to better understand how researchers’ reported attitudes and experiences correlate with detectable practices in publications.
PLOS admittedly has its own motivations for this initiative; the information is essential to support a strategy that aims to increase adoption of Open Science and to better understand the researchers we serve. But we know that reliable information on Open Science practices is valuable to others – funders and institutions, researchers, and publishers. Whether they are seeking a better understanding of their current state, an understanding of the impact of policies, or whether they are strategizing for change, it’s clear we all need better evidence to support these activities. And with better evidence, perhaps we can empower more of us to act to help make intelligent openness the norm.
Thanks to Tim Vines and Veronique Kiermer for their comments on a draft of this blog post.
Discussion
4 Thoughts on "Guest Post – How Do We Measure Success for Open Science?"
This is a very interesting post Iain. Thanks for sharing. I applaud your work and think it’s generally on track. From a high level, there might be another way of thinking about this challenge though—maybe an add-on to your current efforts?
Essentially, there’s a problem with the way our community has chosen to embrace “open science.” It’s simply not as discrete and definable as many have made it out to be, and this has led us to reason (incorrectly, I think) that if open science equals x, then it therefore stands to reason we can achieve open science by doing y, and the benefits of these actions will equal z. The reality is much more complicated, as I’m sure you’ve seen from your vantage.
There’s also a cetain glamorizing of open science going on (community wide) that is misdirecting our focus. Specifically, open science (however we define it) does not by itself lead to integrity, reliability, transparency, impact, or the other virtues of good science. It’s the other way around, in fact. Open methods are important tools for making science better, but our focus should also be on making science better, not just making it open.
So, given these two caveats, trying to put a wrapper around open science and measure its progress might be more helpful if we also track our progress toward achieved open-realted goals. What is it we’re trying to achieve with open (and this will vary by field, of course)? If we measure our progress toward these instead of just the components involved (e.g., how much data and code are accessible), we are more likely to incentivize the right behaviors and solutions; we will also be able to develop best practices and lessons of experience and share these across fields and institutions. After all, creating a world of more Excel spreadsheets isn’t going to help anyone. What’s needed are more efforts that combine and curate data with a eye toward making open data useful instead of just an accomplishment—with an eye toward making open data a tool we use in pursuit of larger goals, not the goal itself. These efforts aren’t all going to align with FAIR and other prescriptions, as you note in your essay, but the exciting part about this approach is to see where the research-led, need-based innovations might lead us with open.
Thanks for reading Glenn and sharing these thoughts. I agree that we can’t solely focus on these measures of Open Science in the long term. Importantly, what we are not doing is creating new “metrics” or “rankings” with these numbers. Open Science Indicators are just that – *indications*, that need to be combined with other insights to offer maximal value. It’s clear, also, that the target for these is not 100%. Differences we can observe between fields, regions, and other cohorts of researchers/ papers, can help us understand barriers and motivators to adoption — and, I believe, helps us find more of the “needs-based innovations” you describe.
In the framework and definitions (https://doi.org/10.6084/m9.figshare.21640889) we prepared when embarking on this project, as well as things we would like to measure to determine if research outputs are Findable and Accessible, we envisage in the future assessing things more related to quality and impact of the outputs. Doing this at scale is of course technically more challenging, although there are some exciting developments with FAIR-assessment tools (https://www.fairsfair.eu/f-uji-automated-fair-data-assessment-tool) for example. We’ve focused on detecting the prevalence of these practices (F and A) as a pragmatic starting point. It was also important to show this is possible across multiple publishers using the same approach.
I also agree that “more open science” is not the end game. But I see it as a logical prerequisite to realizing more of the benefits, and being able to better answer the kinds of questions you raise — such as whether and how research has been reused, what impact or benefit that has created, and for whom.
Hello, I agree that information on OA is essential. However, I have a problem with PLOS with this regard.
I’m trying to get a full PLOS metadata dataset here: https://plos.org/text-and-data-mining/
“This zip file contains JATS-standard XML content of every PLOS article, including all Articles and Front Matter … It’s just under five GB in size, and is updated every day with new articles”.
After downloading it, I’ve found no recent articles. In fact, the most recent are from 2019. Is there a real dataset that gets “updated every day with new articles”?
Hi Ivan,
Thanks for your feedback. A more up to date, downloadable version of the PLOS corpus is available in the “all of PLOS” API on Github (https://github.com/PLOS/allofplos). We used the all of PLOS API to download the PLOS corpus to construct the dataset. More information on how the Open Science Indicators dataset was constructed, for PLOS and non-PLOS content, is in the Methods documentation file, along with the dataset in Figshare: https://plos.figshare.com/articles/dataset/PLOS_Open_Science_Indicators/21687686?file=38504798