In March of 2021, in the midst of a lockdown, while most of us were at home spending way too much time on our computers, Altmetric quietly changed its explanation for calculating Article Attention Scores, reducing the weight it placed on Twitter mentions by 75%.
No one seemed to notice, except for Kent Anderson, who reported his findings yesterday in The Geyser.

Maybe we shouldn’t entirely blame ourselves as Altmetric made these changes without a press release, blog post, or even a tweet.
If this were merely a story of a company dealing with the chaos of its staff working from home during a pandemic, we could be more understanding. Most of us were going through a lot in March. We should give companies a little slack.
Yet, Article Attention Scores for papers don’t seem to add up, leading one to question whether Altmetric data are valid, reliable, and reproducible.
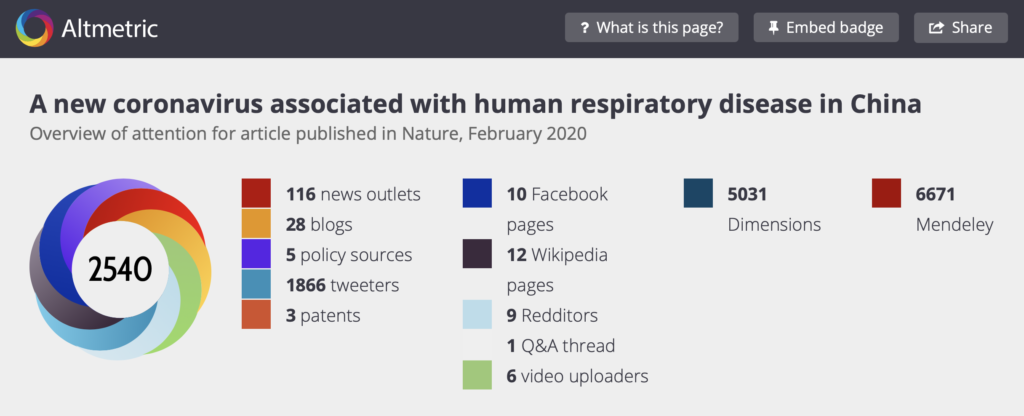
Consider the following paper published in Nature early in the pandemic:

Based on Altmetric’s current description of how it weights sources, this paper should have received an Attention Score of 1601. Changing the weight of Tweets from 0.25 back to its older weight of 1, and we arrive at a score of 3000. In either case, I can’t seem to get close to 2540 even by rounding component weights. It is not clear how this paper arrived at its current score unless Altmetric was mixing the results from its older and newer weighting models.
Even much simpler examples for recent papers don’t add up. Consider this viewpoint, which was published in JAMA on August 17, 2021. With an Article Attention Score of 25 (measured on Aug 22, 2021), it should have received a total score of 11 (1 blog x 5 points + 25 tweets x 0.25 points = 11.25). Even using its old weighting system, the score should be 30 not 25.

According to a Customer Support Manager for Altmetric, whose name the company asked be redacted from this article, the company did not change its algorithm for calculating Attention Scores, only its support page, as it was causing confusion for users. As she explained by email, the weight of a tweet can vary between 0.25 and 1 depending on a lot of factors. For simplicity sake, they decided to display the minimum weight a tweet can contribute to the score. I’m not sure that this change helped to alleviate any confusion; if anything, it just caused more.
The range in values that any social media mention can take is not clear from their support page and, as illustrated in the above examples, it means that an Attention Score can vary greatly. More importantly, their model means that Attention Scores are largely impossible to reproduce.
Given the widespread lack of interest in how Altmetric’s black box operates, that Altmetric proudly promotes lists of top-scoring papers by field, and that bibliometricians and armchair analysts use Altmetric data to do research, one thing is completely clear: We have all been lulled into a false sense of accuracy driven by the number inside the donut.
If Altmetric wants to create trust with its product, it has just two options: Adopt a fully-transparent evaluation model where users know exactly what every media type is worth, or ditch the number entirely.
Discussion
18 Thoughts on "Unpacking The Altmetric Black Box"
Hi Phil,
Thanks very much for your post – we’re both surprised and appreciative that you follow our activities so closely. Thank you for taking such interest, and for the useful feedback which we will certinaly take into account as we further develop our offering.
As our Customer Support Manager correctly informed you, we have made no updates to the Twitter score contributions. What we have done is to further refine (and try to improve) our support documentation – so that it reflects more accurately the weighting that drives the final Altmetric Attention Scores.
In the case of Twitter, we take a number of factors into account in determining the weighting of a single tweet. These factors include whether the Tweeter has shared that research output before and also how often they have Tweeted any output hosted on the same domain within a given period. The single tweet weightings range from 0.25 to just over 1, with the most common weighting actually being 0.25 – which is why we updated our documentation.
Wherever possible we make our data as transparent and auditable as possible, and particularly those sources which contribute to the score and donut – to this end you can explore each of the individual original ‘mentions’ of an item on its associated Altmetric details page.
We have always, and continue to, emphasize the importance of scrutinising the underlying data rather than taking the score as an indicator of the value or quality of any research output. The Attention Score is designed as an indicator to help users identify where there is activity to explore, and to help them easily see how the volume of that activity compares between research outputs.
I hope this information is useful, and we’d be happy to chat further if you would like to connect directly.
Best,
Cat Williams
COO, Altmetric
If the Attention Score is “an indicator to help users identify where there is activity to explore, and to help them easily see how the volume of that activity compares between research outputs,” why not just sum up activity without modifiers, weightings, and black box manipulations? Wouldn’t that achieve the same end without creating confusion for users, trust problems around the score, and reproducibility issues linking both of those?
Why the sophistry?
Hi Kent, yes that would be a potential solution, and is something we’re considering. The modifiers were put in place to try to present a reflection of true engagement (e.g. researchers sharing an output rather than the journal just tweeting it lots of times), and to present a more useful indicator of reach – so for example an international news outlet contributes more to the score than a niche, local outlet.
It’s certainly something we continue to evaluate, whilst emphasizing the importance of the underlying data.
More transparency would be great. But, of course, as you say, this is not really new, given that Altmetrics has always pointed out that the weights vary, such as by “promiscuity” (Twitter accounts that frequently link to DOIs are valued less) at https://help.altmetric.com/support/solutions/articles/6000234288-altmetric-attention-score-modifiers
I wonder, can CrossRef’s Event Data serve as an alternative? Are there studies or blog posts on that? They certainly are more transparent than Altmetric. And free and open. However, CrossRef Event Data does not calculate single-indexed “scores” and does not offer visually appealing donuts like Altmetric.com. Anyway, it would be interesting to see a project harnessing CrossRef Event Data. Maybe a kind of OOIR at https://ooir.org/ that relies not on Altmetric, but on CrossRef Event Data, and see how it goes.
The idea of a having a single, authoritative, number is complicated and always has been. Every citation of scholarship is subjective (especially coming from e.g. Twitter, which doesn’t have any of the citation norms of scholarly publishing). More importantly, every *use* you might have for a metric is subjective too. The underlying data can (and IMO should) be made open, but it will raise more questions than it answers.
I’m a very strong beliver in open data for altmetrics. But it does force you to think, and hard. Here’s five principles I proposed for community altmetrics data, and the consequences: https://blog.afandian.com/2018/05/five-principles-altmetrics/
There is a responsibility on metrics consumers to be clear about what they want from the data, and to acknowledge that any single number probably *should* be treated as a black box because there’s no hope of it meeting every single subjective usage. But I think Altmetric has only ever sold it as a “look over here, this is interesting” score.
Crossref’s data can play a very useful role (disclosure: I built most of Crossref Event Data), but IMO we also need to see more public conversations about what people can reasonably expect, and the responsibility of metrics consumers. These conversations have happened, for years, at the Altmetrics Conference and Workshops, but I don’t often see that dialog in the broader community.
Writing in a personal capacity.
Another example: https://www.altmetric.com/details/70463471
The article “The most mentioned neuroimaging articles in online media: a bibliometric analysis of the top 100 articles with the highest Altmetric Attention Scores” has one blog mention and one tweet, and has 9 Altmetric Attention Score. According to the weight table a blog mention gives 5 points, a tweet gives maximum 1 point, so the score should be 6. A more detailed explanation is available (https://help.altmetric.com/support/solutions/articles/6000234288-altmetric-attention-score-modifiers) about the Altmetric weight modifiers, although there are no modifiers mentioned about blogs.
Could the 6 have been rendered upside-down?
Is there any research on the inclusion and weighting factors for the score compared with alternative inclusion and weighting strategies? I would be interested in better understanding the conceptual rationale and some empirical evidence related to construct validation of what the score is intended to reflect. If that work hasn’t been done yet, perhaps there is some opportunity for collaboration between DS and the metascience community to review and evaluate the scoring methodology.
Interesting point Brian, I think there should also be some research on the anti-gamification, my understanding is one of the reasons for algorithm/scoring is set to offset the same people Tweeting over and over on the same article, but it does look like this could be made clearer so results can be understood and replicated, reading this support page that is https://help.altmetric.com/support/solutions/articles/6000233311-how-is-the-altmetric-attention-score-calculated-
There are challenges to changing the score methodology too, especially with all the historical data, I believe Altmetric have an excellent team of advisors who review and consider this from time to time.
Having the Altmetric score, and the ability to filter both on the total score, and individual tracked sources via the Altmetric Explorer product is helpful, but again needs to be looked at in context, many news item pick ups are syndicated, many Communications officers still don’t correctly site the article source in the news, hence the mention is missed.
Perhaps it’s time for the altmetric-con probably around 10AM by now (1AM, 2AM, 3AM etc) or for this to be brought more openly in to a wider community DORA/NISO/CrossRef/metascience discussion/panel/pop-up meeting. It’s certainly a good point to be raised, and I hope healthy and positive discussion going forward will come from this post.
Yet another reason to refocus on the principles that matter.
What are we supposed to be about, if our aim is to engage as professionals in scholarly communication? Surely it can’t be tweets and donuts, which we’ve seen can be manipulated and modified–perhaps years in the past–without the awareness of those whose work is being measured. It shouldn’t even be about things like the Impact Factor, which present more professional and have a scholarly veneer…as long as one doesn’t try to open the door too widely.
Chasing the buzz has brought us to an uncritical embrace of words like “open” and “transparent” losing their meaning, and to an acceptance of things — like preprint servers — that are causing us to forfeit our credibility with the people our work is meant to serve, as posts to preprint servers make their way to the public via mainstream media outlets with coverage no different from that of landmark articles in brands like NEJM and JAMA.
Maybe we’re supposed to be about the quality of the work, and reliable processes that deliver the kind of quality that we’d want to trust our lives and health with.
We can be better than tweets and donuts.
The once or twice a year deep dive into Altmetric pearl clutching is a curious example of how our industry can’t resist poking at a good solution. MANY working in this space (from pharma companies to individual academics) have been looking for an easy, comprehensive way to gather and assess this kind of data. Altmetric took one approach. Plum did another. CrossRef has their event data. But for some reason, Altmetric use of delightful visual and a number (which is optional to use) really attracts the pointy hats.
The market asked for something easy to use and understand. When they saw the number (and strangely the donut — it’s like something delightful really triggers a strong reaction), they railed at the lack of nuance. Altmetric always pushes folks to dive into the actual mentions to evaluate for sentiment and context. They always stress that the number doesn’t mean much. When they show how to dive into nuance, the community complains about how much work that is and how no one has time for it. So it’s lose lose all around for a company that provides an innovative solution to a challenging problem.
Are there issues with their approach? OF COURSE. But for an organization that’s fairly transparent and incredibly generous with making their data freely available to researchers and libraries, I’d love to assume some good faith out of the gate. Kent’s piece and TSK’s band wagon-ing is click bait and it’s a shame.
Full disclosure: I worked at Altmetric from 2014-2019 and on the Dimensions platform from 2018-2019.
“They always stress the number doesn’t mean much” yet feature it at the center of what they offer.
“Are there issues with their approach? OF COURSE” yet anyone pointing out these issues is engaging in producing “click-bait.”
Plum avoids these problems by just surface the counts. It seems the problem is in the black box synthesis of inputs in ways that make the number irreproducible.
As noted above in an exchange with the COO, why not just remove the problematic part? Why not removed the “number [that] doesn’t mean much,” as you say?
I think there’s a bias, particularly in the science world, against qualitative analysis, and a strong desire to see everything ranked on a mathematical index. To me, this is why there’s demand for a number score, and thus a good business reason for including it (give the customer what they want).
That said, if there’s going to be a number, it should be reproducible. If Altmetric has a complicated formula for how much different tweets count, ideally the math showing the results of that formula should be available as part of the score. For example, I just pulled up an article that has an Altmetric score of 3, which is made from the article being tweeted 4 times. I can see the tweets and who tweeted it out, but I have no idea how those 4 tweets translated into a score of 3. Why not offer those details (this Twitter account has X followers and does Y, so its tweets count 0.37 toward a score)?
One of the biggest (and fairest) criticisms of the Impact Factor has been that it is not possible to reproduce it (dating back to 2007: https://rupress.org/jcb/article/179/6/1091/54138/Show-me-the-data). Is this criticism of the IF unfair, and if not, is similar criticism of Altmetric scores warranted?
They surface every mention. Click on the mentions tab.
Why not remove the number? Because the number is helpful for some communities. Those who show it, choose to intentionally. Why not ask their many publisher customers on why they show it? Why not ask researchers? Those who use the data to evaluate grants etc? To the folks at CDC who use it to evaluate mis information? High scores and specific colors give an at a glance view to tell you when “something is awry.” If Altmetric’s customers are using it and they don’t require it, why can’t you, Kent, just ignore it? We all have agency in terms of how we engage with data, and all traditional metrics have exactly the same context and nuance issues. And a lot more ppl misuse/over value impact factor, citation counts etc. So why all the high dudgeon over this particular number?
I run a popular and successful Substack newsletter that engaged in “optimistic criticism,” which means finding things that could be better, identifying the problem, and believing that in good faith those who see the problem will fix it. As Jaron Lanier says, “. . . criticism has . . . optimism built in. . . . I think in the very act of criticizing it I’m expressing a hope that we’ll find our way out.”
If Altmetric and its past employees are devoted to defending a status quo situation that is easily solved, would not reduce clarity, would enhance utility, and would make people trust the results more, that’s not up to me. But this “shoot the messenger” attitude is all too common among once-innovative companies.
I’m careful to offer suggestions on how to solve the problems I identify. I’ve done it repeatedly here, and in the posts I’ve put up.
What’s your solution to a number you hinted holds little meaning and to an approach you admitted has issues? More of the same?
Why should it be up to the user to “ignore” something that is opaque and/or misleading? Why is pointing that out — particularly given how straightforward it would be, in this case, to do it right — seen as problematic? I’m surprised by the emotion in these responses to a seemingly straightforward inquiry.
I’ll reply to a couple people in this one last comment and call it a day.
1. To David’s point, I cannot say definitely why Altmetric doesn’t give the exact algorithm. I leave that to the Altmetric team to speak to. I buy the “secret sauce” argument and I buy the “be transparent” argument. It’s probably better in the long run to be transparent and share how the math is done. I think it enhances Altmetric’s business proposition and would put a lot of this stuff to rest. Ppl can argue with the weightings but who really cares? I would argue Altmetric brings much more to the table than just the score so sharing how it’s calculated wouldn’t be a competitive loss.
2. Seth – users ignore features they don’t like/need all the time. Many Altmetric users find both the scores and colors useful. You don’t. So click on the donut, dive into the counts, the mentions themselves and disregard the score. It seems like a small thing? I don’t use have a the built-in functionality of most apps I use. Probably neither do you.
You might argue, “well the score is central point of the app.” Not so as you’ll see in all the positioning information on the data. As for the score being misleading — I would argue that the score is only as misleading as any other quantitative metric and it’s not nearly as widely used as other quant metrics. Doing it “right” is in the eye of the beholder and for those using the score to monitor certain kinds of activity, it’s a vital feature. For those that don’t find it vital, they can choose to not show it. Customers have this choice.
3. Criticism should always have optimism built it, Kent. I absolutely agree. But let’s be fair: from the bit of your post I could read — as it’s behind a paywall — and the tone of the article above, the gotcha tone is unmistakeable. Phil jumps from the giving the benefit of the doubt to Altmetric to “question[ing] whether Altmetric data are valid, reliable, and reproducible” in once sentence. All this without independently verifying your claims or apparently asking Altmetric for comment.
If Altmetric is keeping their algorithm opaque it’s likely for competitive advantage reasons as it’s critical to their USP. Much like Kent choosing to put his content behind a paywall, both “less than accessible” choices are thoughtfully and intentionally made. If Kent or Altmetric choose differently — recognizing that transparency around an algorithm and access to paywalled content are not the same thing — they have to carefully consider the impact that has on their businesses and competitive advantage. I encourage Altmetric to consider making their algorithm publicly accessible. Until they do, I will continue to focus on the bits of their data that I DO find useful.
Just trying to keep baby in and bathwater out.
So, let me get this straight. You haven’t read my article, yet follow that with “let’s be fair”?
I think this conversation has jumped the shark.


