Editor’s Note: Today’s post is by Christos Petrou, founder and Chief Analyst at Scholarly Intelligence. Christos is a former analyst of the Web of Science Group at Clarivate and the Open Access portfolio at Springer Nature. A geneticist by training, he previously worked in agriculture and as a consultant for Kearney, and he holds an MBA from INSEAD.
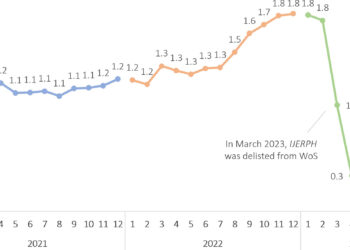
In late 2022, I wrote in The Scholarly Kitchen about publishing speed. That post discussed how publishing has become faster thanks to improvements in production by most publishers and the emergence of MDPI. It also showed that the review process by mainstream publishers has been as slow in recent years as it was ten years ago.
Here, I explore in more detail two research categories, a fast one (Biochemistry) and a slow one (Economics & Econometrics). I show the wild variation in performance among journals that have similar profiles. I also discuss how publishers have become more concerned about speed these days, but they are facing an uphill battle. Finally, I discuss the lack of informational transparency about speed (contrary to other metrics) when researchers assess journals, and how I wish to address the informational gap by collaborating with journal-finding tools, such as the one offered by Researcher.Life.
A tale of two research categories
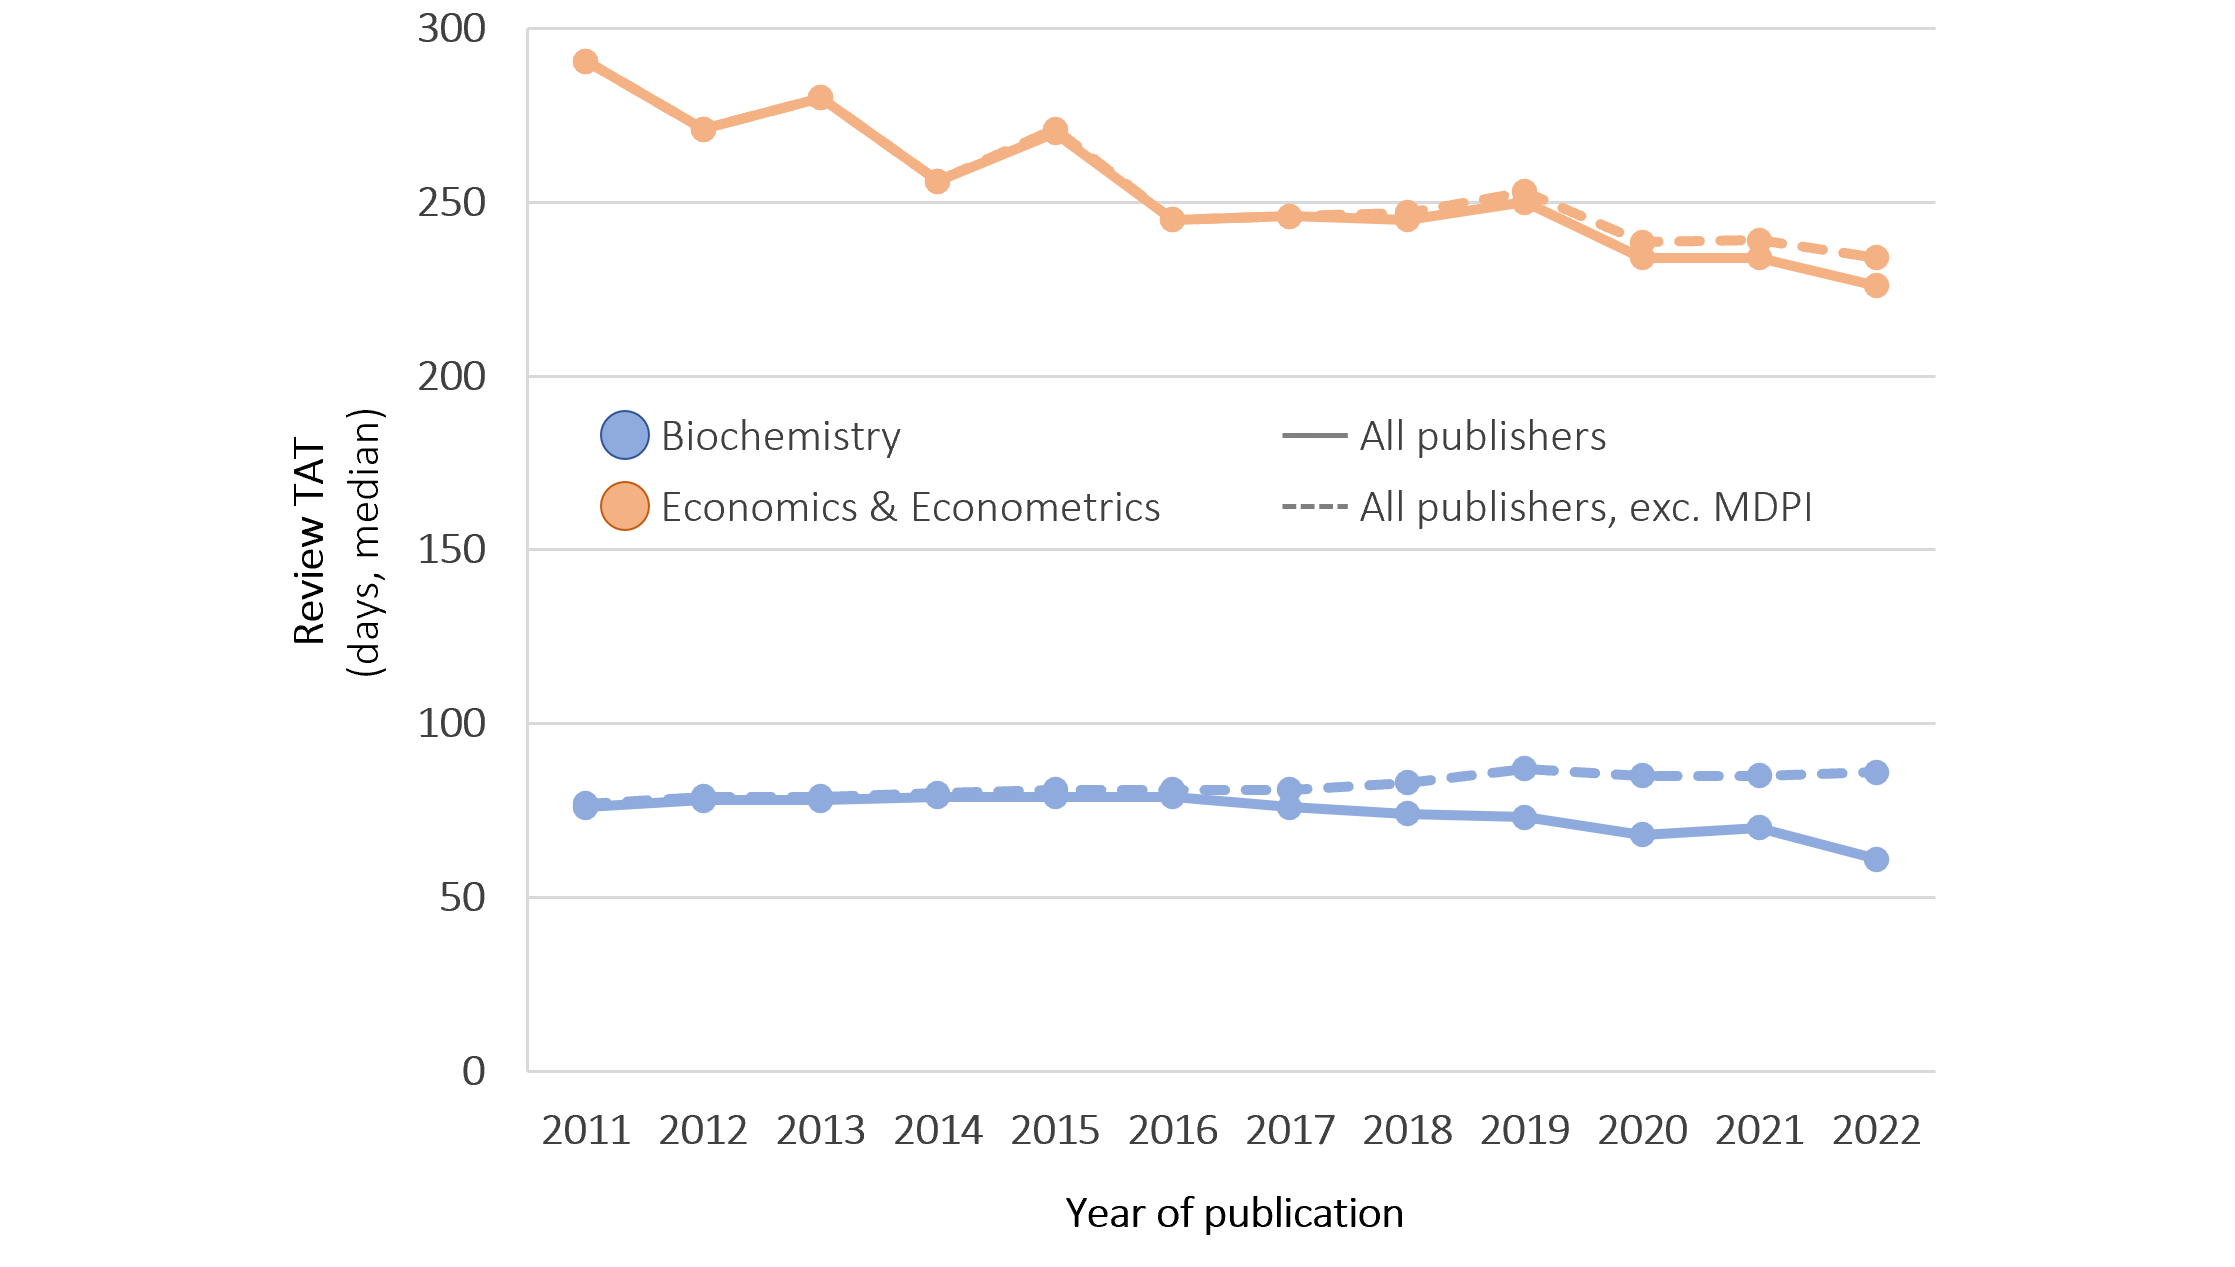
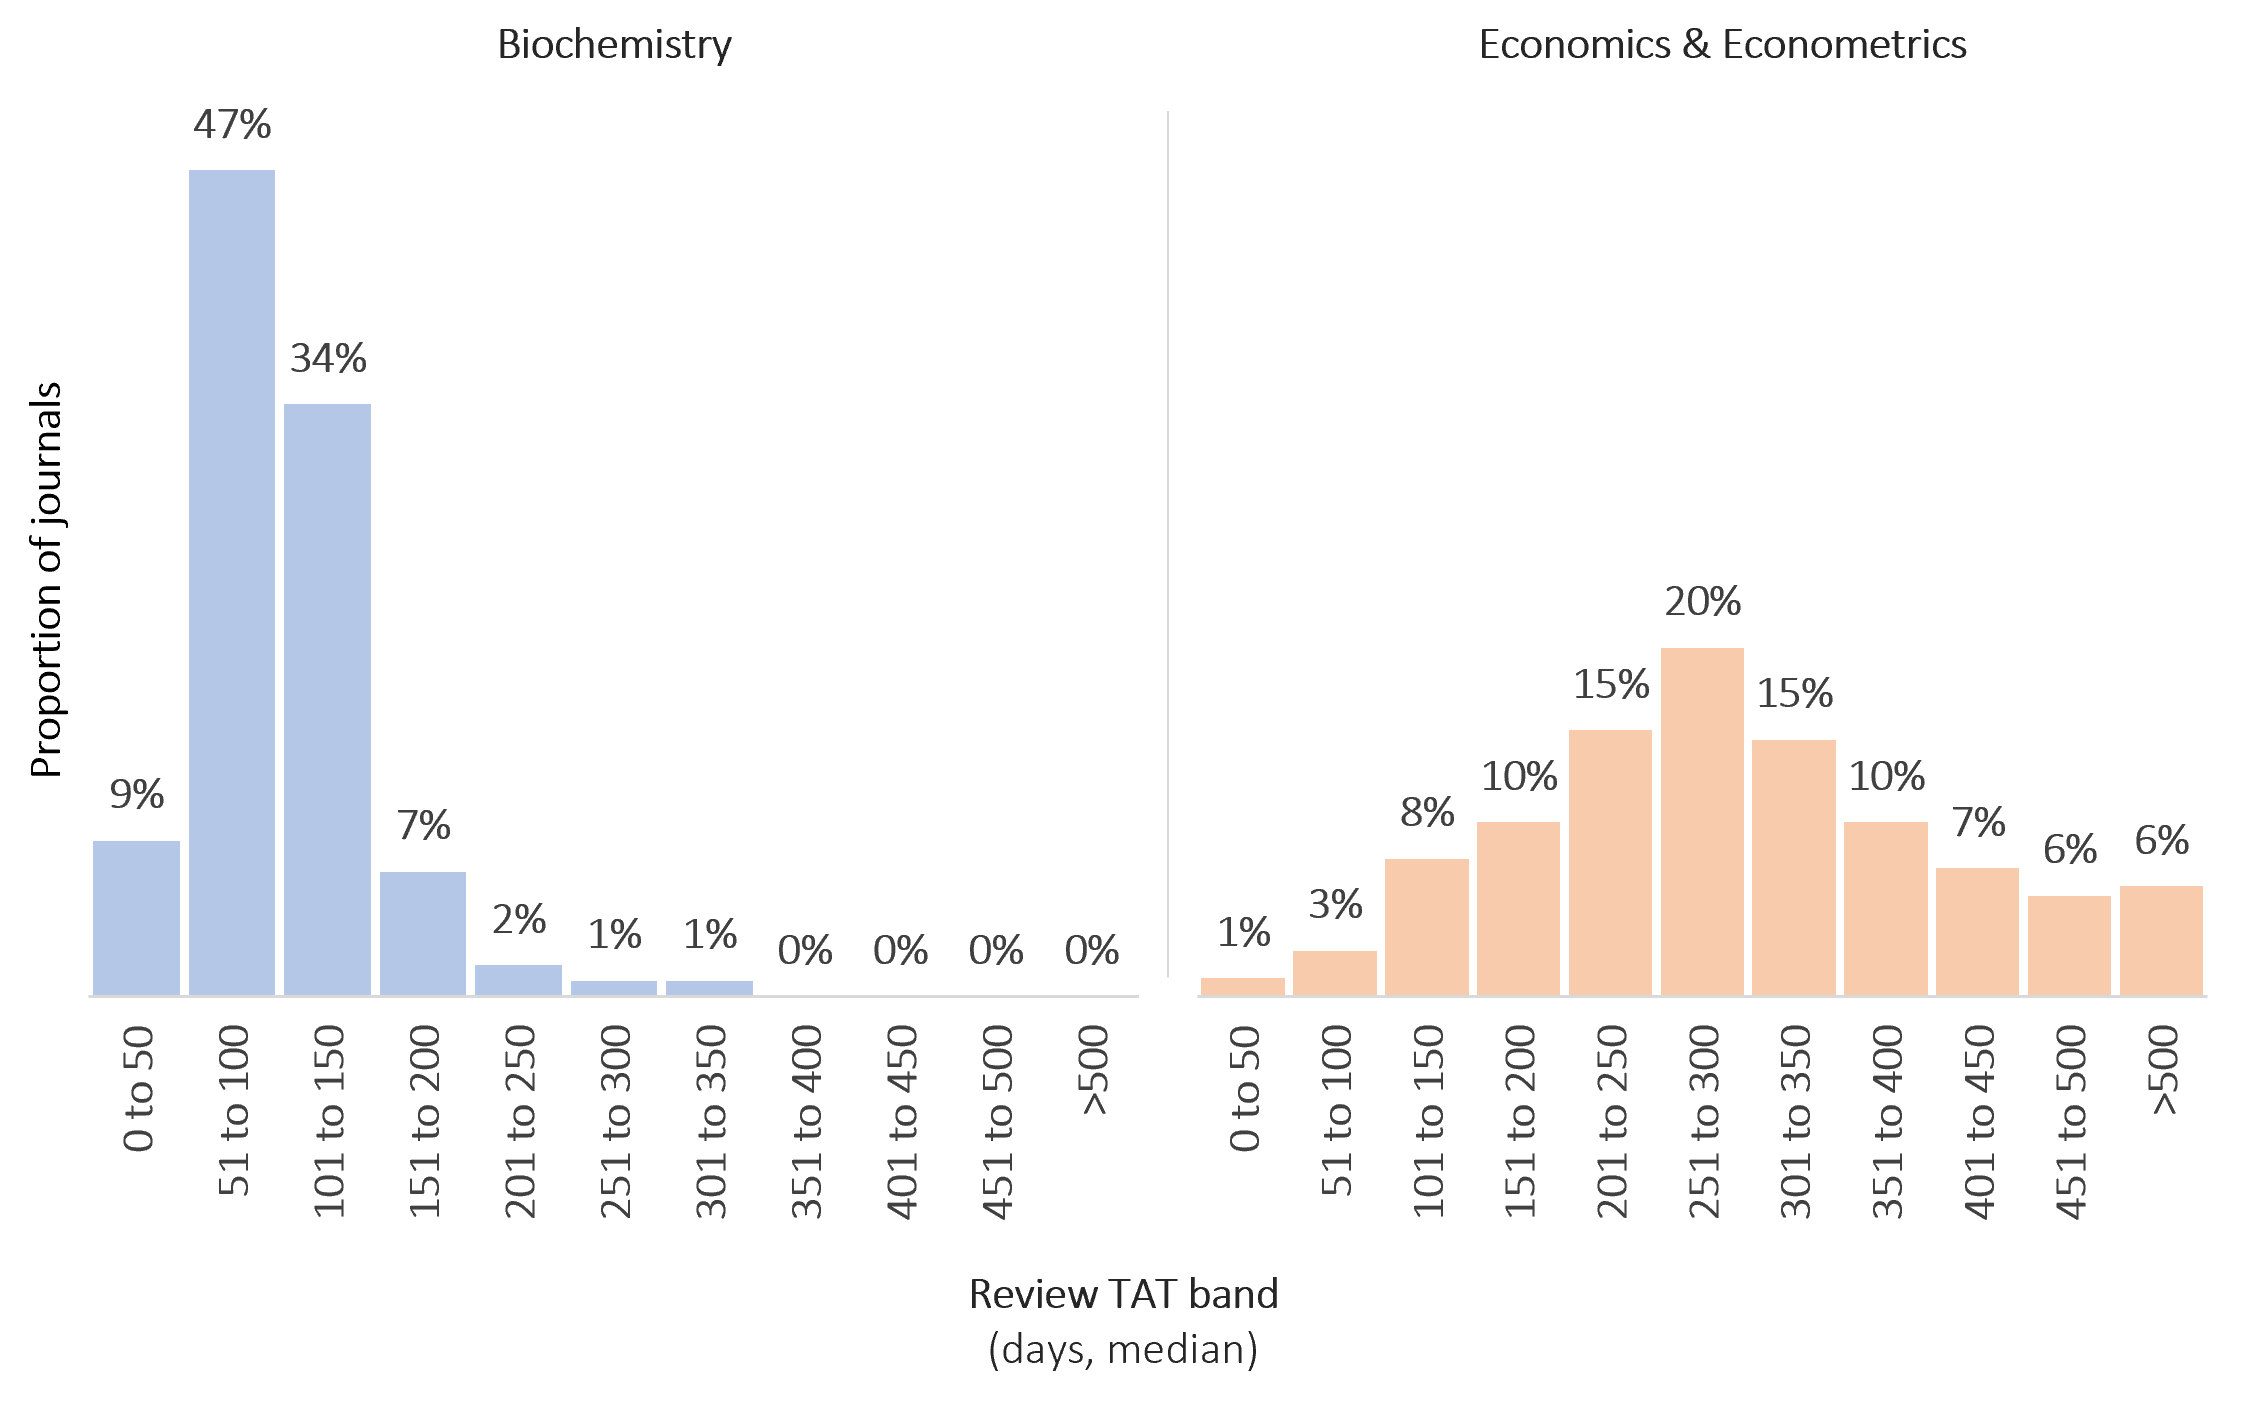
Biochemistry and Economics & Econometrics (categories as assigned to journals by Scimago) could not be more different when it comes to review speed. While researchers in Biochemistry get their papers accepted in about two months, those in Economics & Econometrics have to wait for a good seven months. Even when excluding MDPI, Biochemistry achieves a phenomenal speed performance of under three months to acceptance.
The silver lining for economists is that the category has accelerated by nearly two months in the last 12 years (excluding MDPI), and it is on track to catch up to Biochemistry in a bit more than 20 years.
Fast categories and slow journals, and vice versa
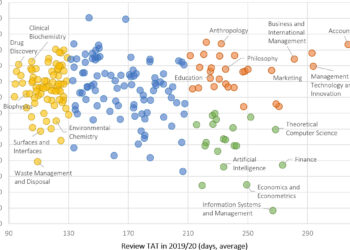
Does that mean that every biochemist will have their paper accepted in two months or that every economist will have to wait for seven months? Not really, because journal performance varies considerably within either category.
For example, about 22% of Biochemistry journals have a median time to acceptance of longer than 120 days, meaning that their authors have to wait twice as long as the category median. Meanwhile, about 15% of Economics & Econometrics journals have a median performance below 165 days, meaning that their papers are accepted two months faster than the category median.
Hyper-selectivity slows journals down; selectivity, not so much
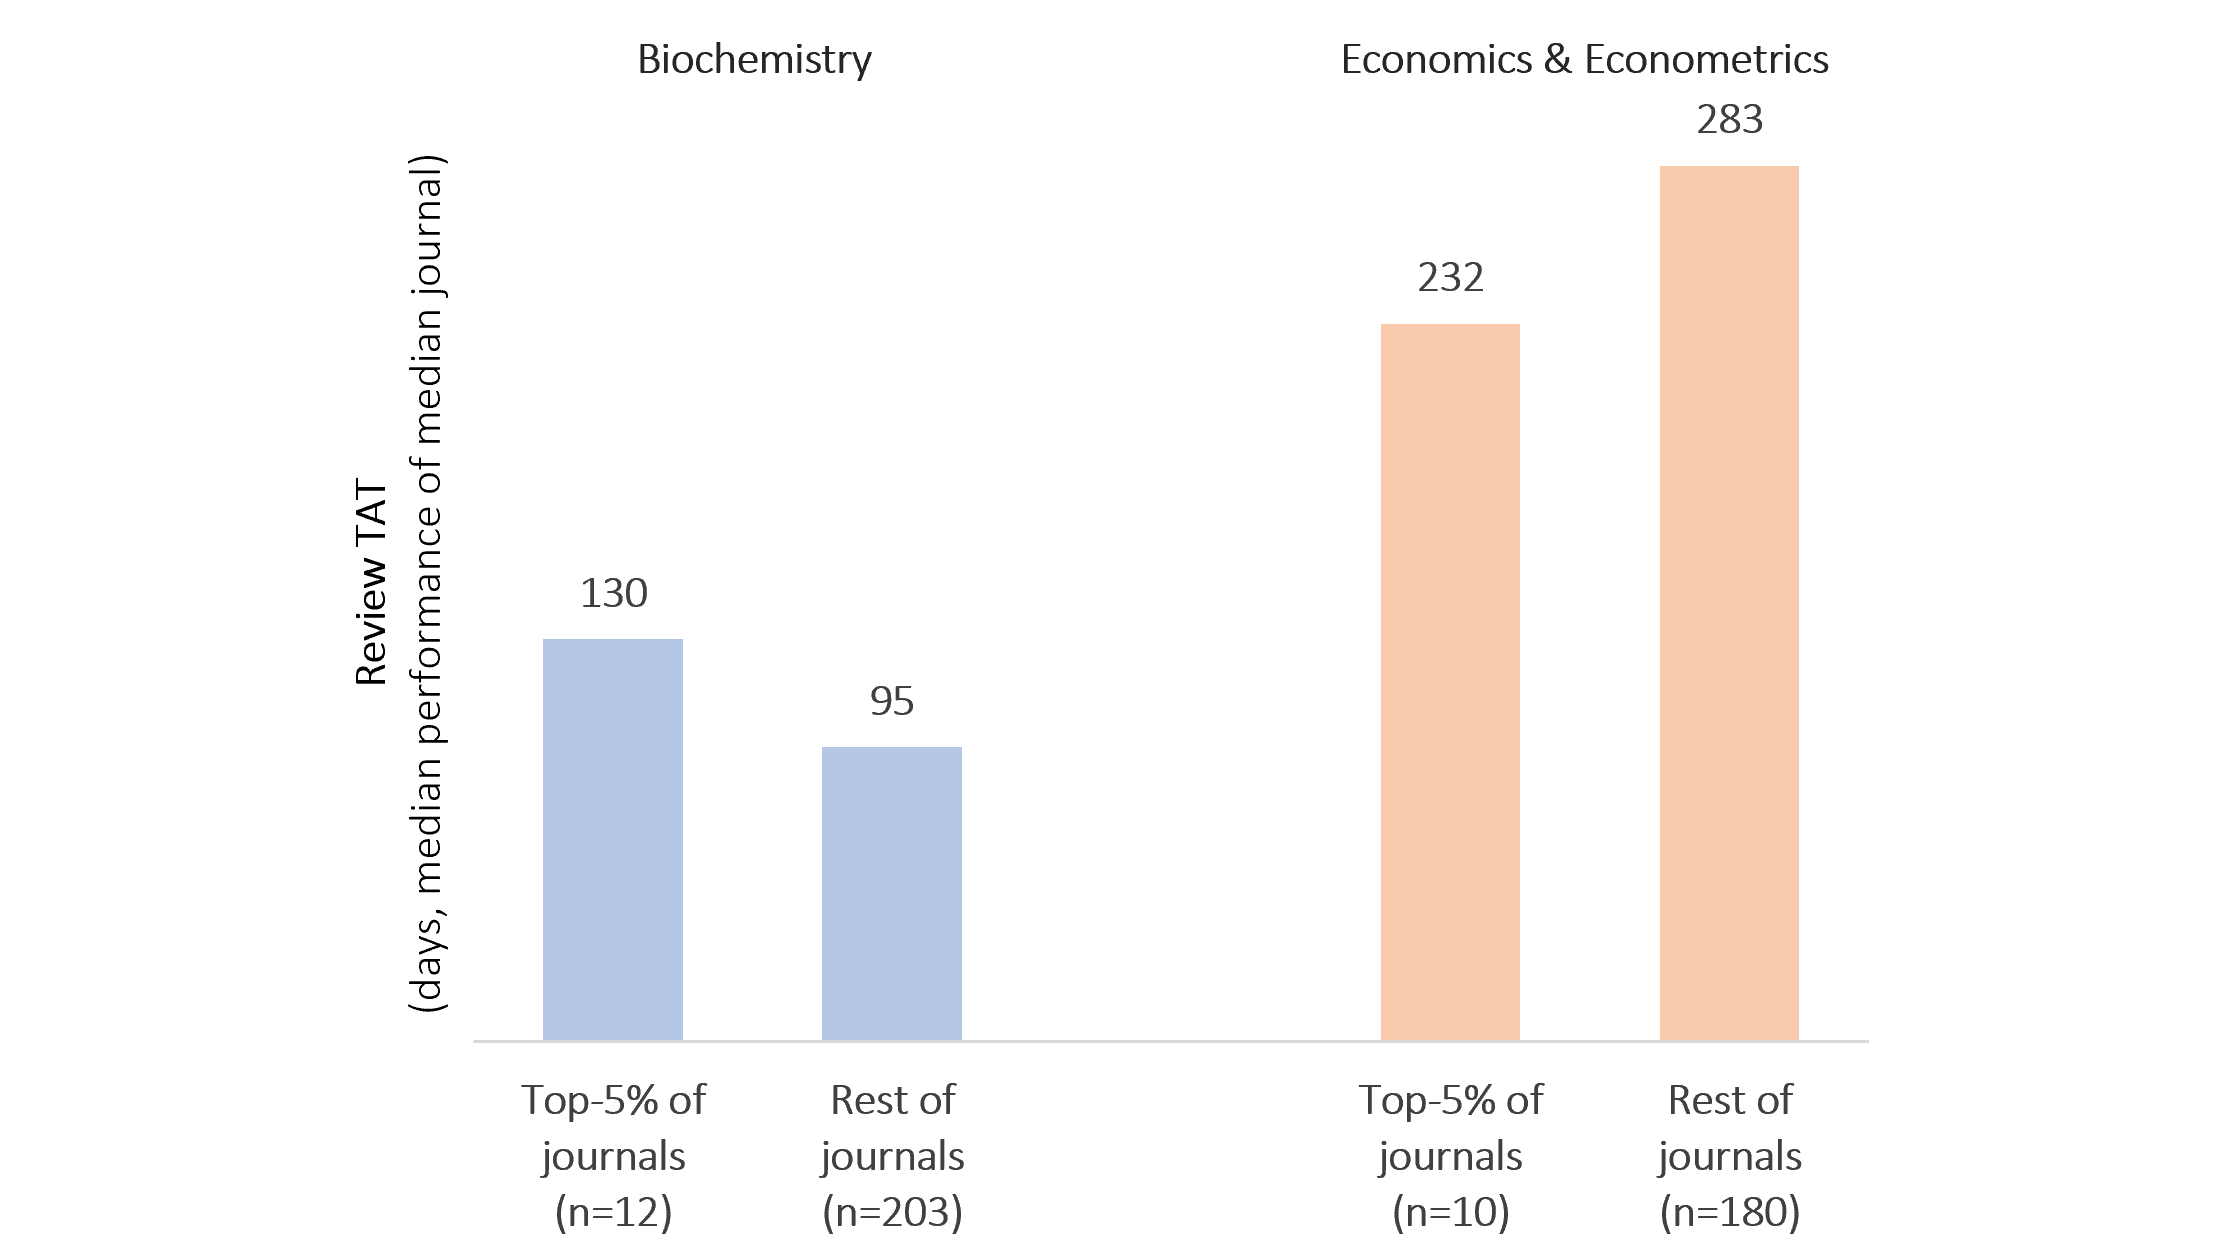
Perhaps what sets apart the faster from the slower journals within a category is their selectivity? Indeed, selective journals tend to be slower, but this appears to be the case only for hyper-selective journals, such as those ranked in the top-5% of journals by citational impact (based on Scimago’s Cites per Document (2 years), calculated as the ratio of citations received by a journal in the current year to the documents published in the two previous years).
For example, the top-ranked journals in Biochemistry are about a month slower than other journals (excluding MDPI). I have found this to be the case in most categories, although it does not appear to apply in Economics & Econometrics, where the top-5% journals counterintuitively perform faster than other journals (excluding MDPI).
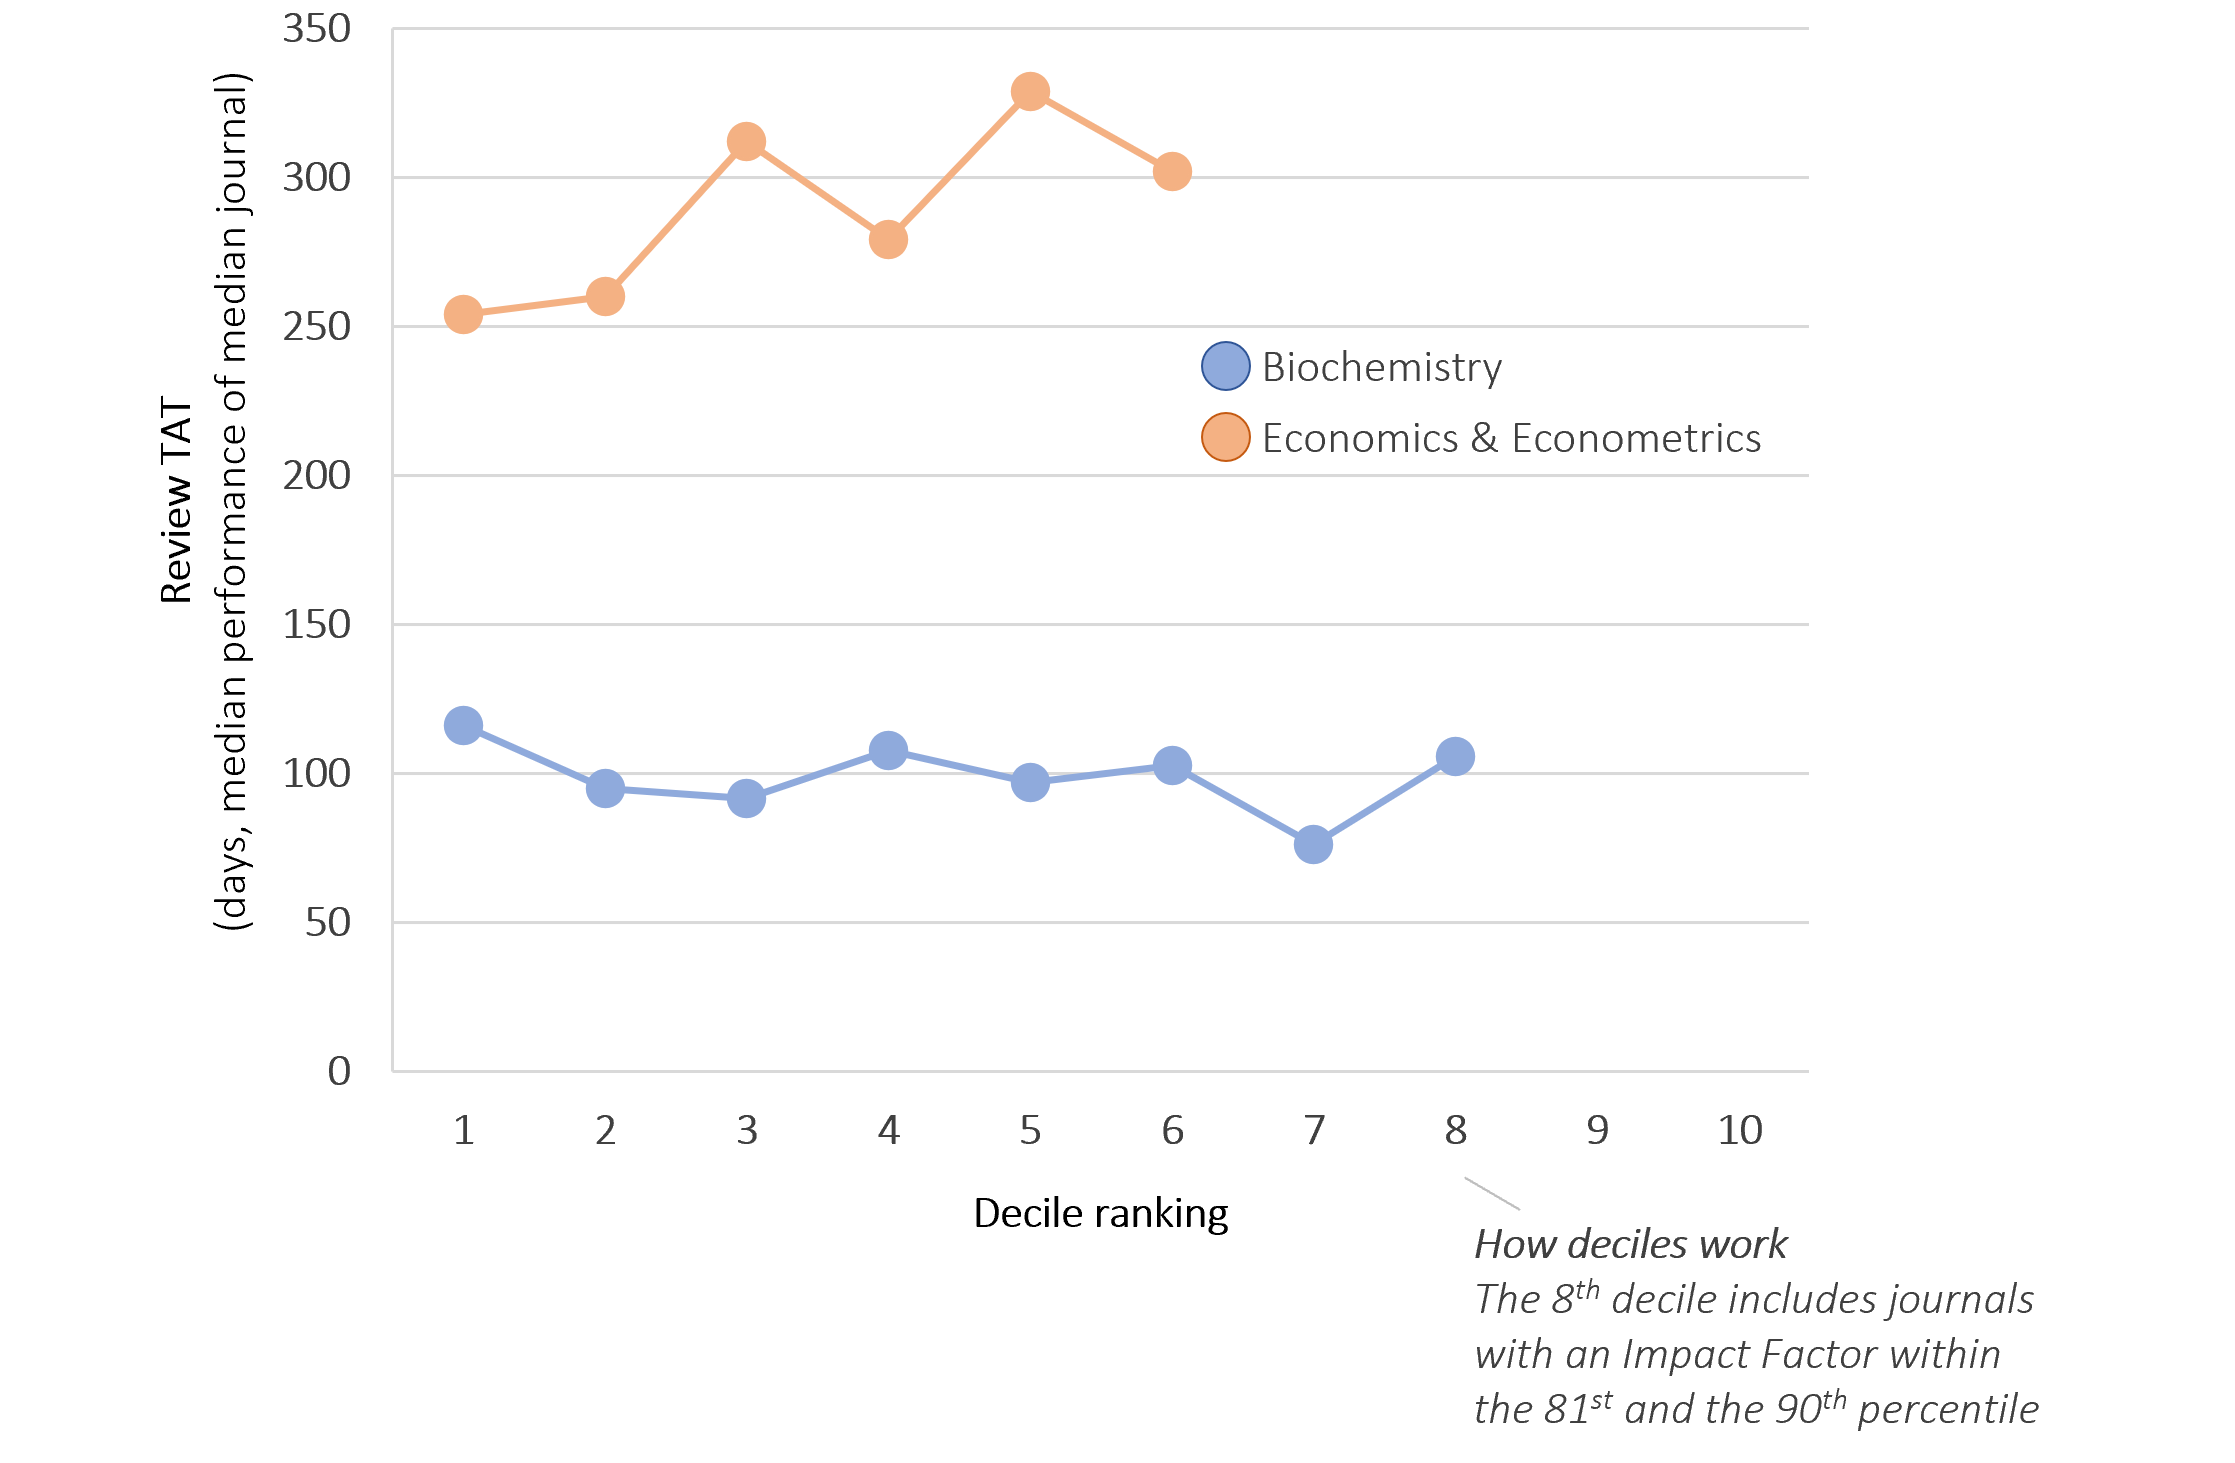
Going down the ranking ladder, speed appears to function independently of a journal’s rank. For example, the Biochemistry journals that are placed in the first and second deciles (ranking in the top-20% of citational impact) are as fast as those ranked in lower deciles.
In plain language, unless the title of a journal is Nature Something or similar, selectivity is likely to be an excuse for a slow workflow rather than the true cause of a slow performance.
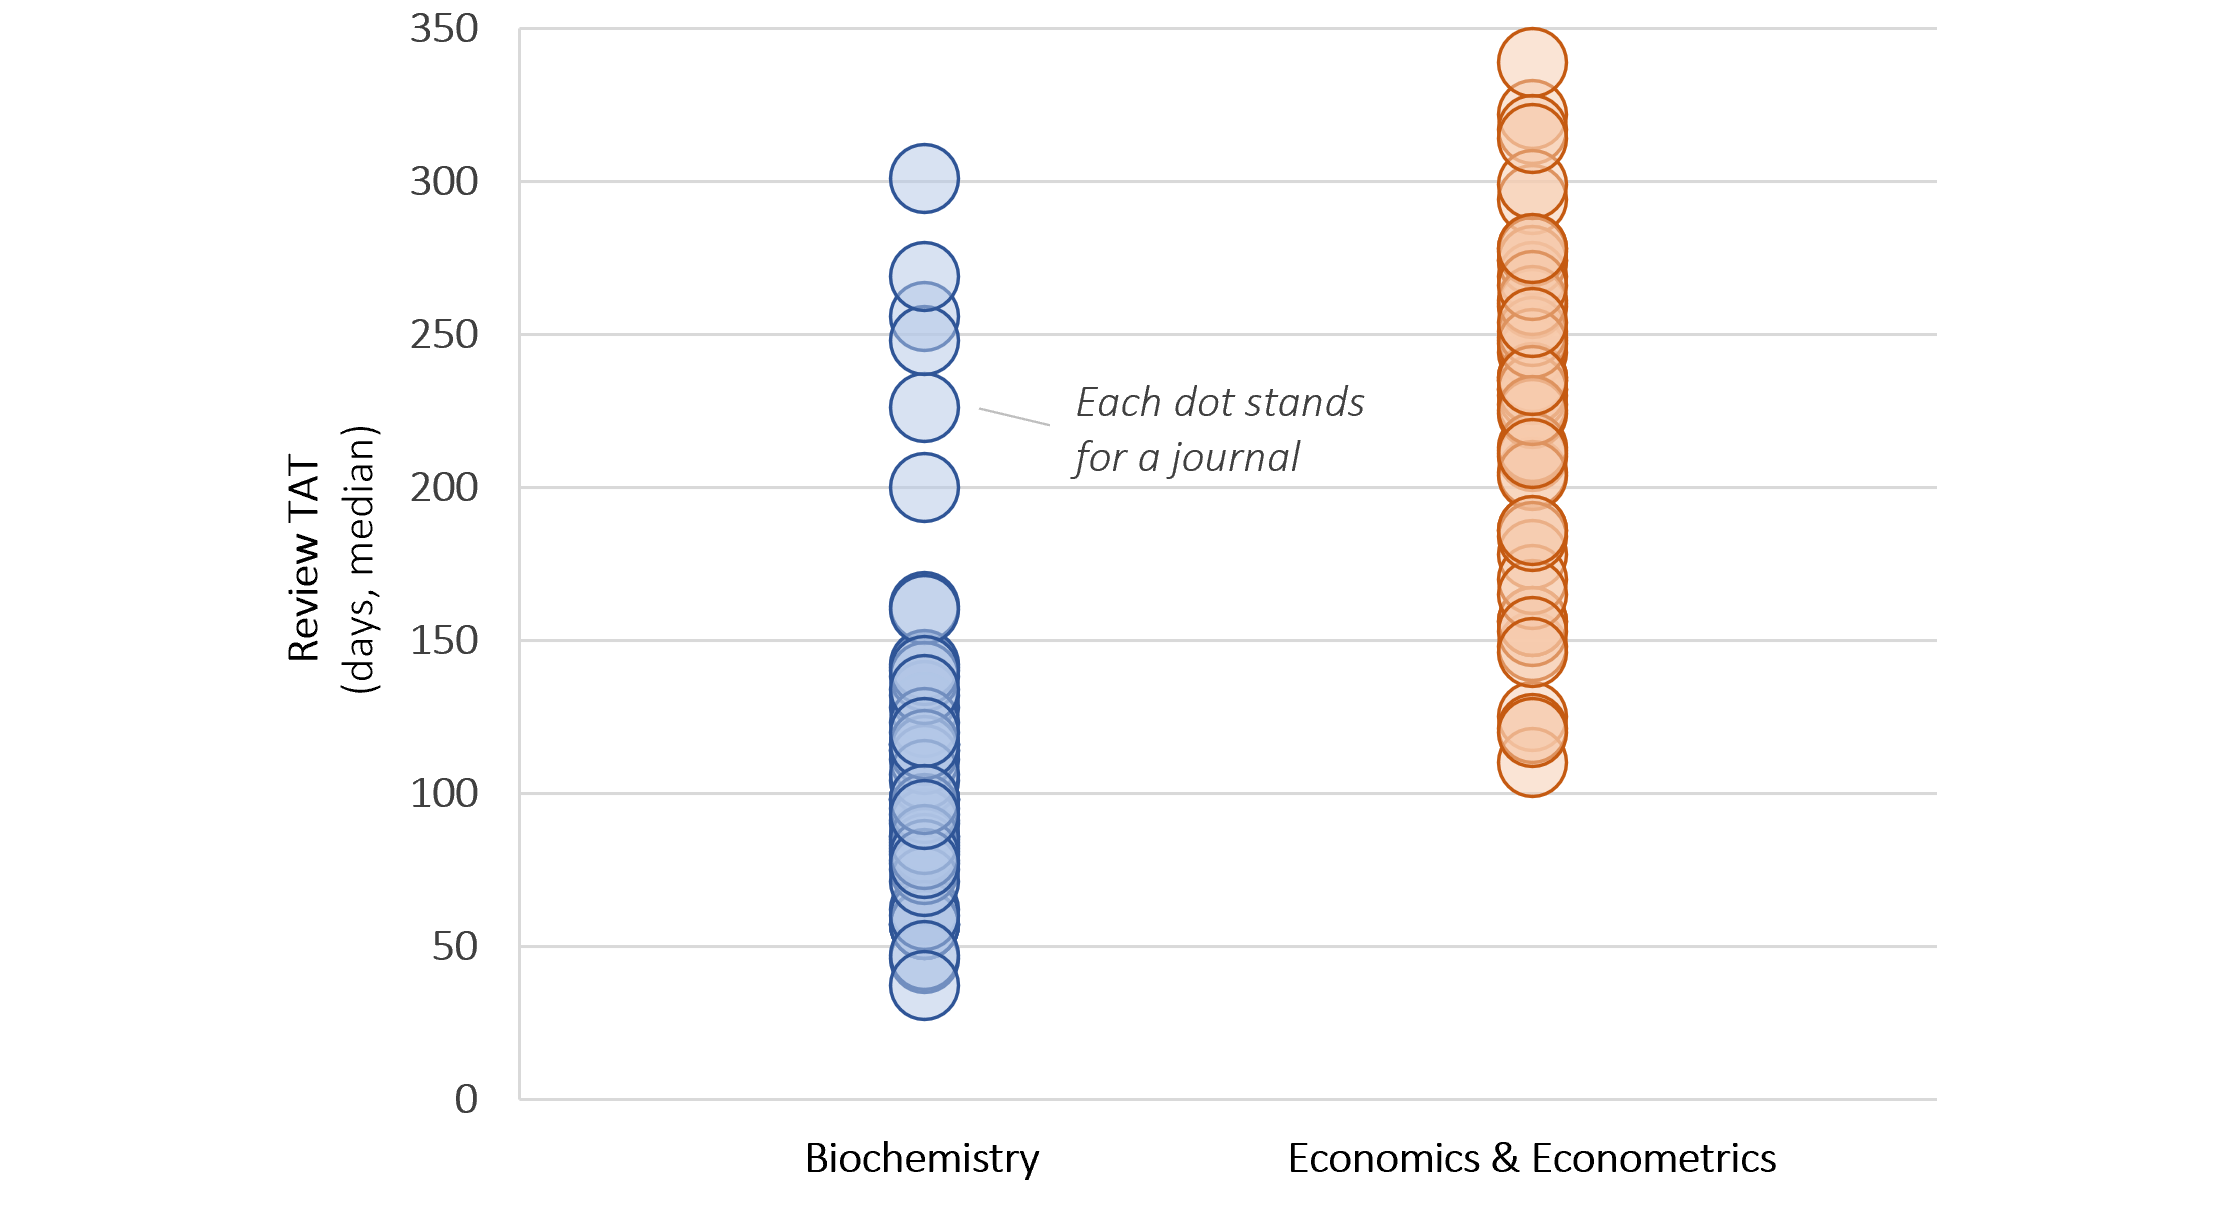
Similarly profiled journals can be fast or slow
A journal’s field and selectivity can affect its speed performance up to a point. There are plenty of other performance drivers that determine a journal’s speed. Some of them can be captured in a statistical model, e.g., the publisher and portfolio of a journal, whether it is owned by a society, and its size. Other drivers are journal-specific and non-quantifiable, e.g., a poorly designed workflow or a temporary staff shortage that has triggered persistent queues. The result is that equally selective journals within a category can have very different performance.
Publishers get the speed wake-up call, but the stars won’t align
In the past, publishing speed was an afterthought for publishers. In the absence of reputable and fast journals that could lure authors away, mainstream publishers had little incentive to improve their operational performance. Then came MDPI, which introduced a paradigm shift. The publisher might have faced challenges with its reputation, but its journals have been both well-cited and exceptionally fast, and have grown phenomenally for several years. Though hard to quantify, it is believed that the speed of publication attracting authors has contributed to MDPI’s growth.
The emergence of MDPI and Frontiers (and the soon-to-be-defunct Hindawi) has meant that mainstream publishers now care about speed more than ever before. At a minimum, they care enough to keep track of their performance and that of their competitors. The savviest publishers have dedicated speed programs or analytics teams that monitor performance and support their publishing and editorial teams to perform in a timely manner.
Addressing turnaround times, however, has been one step forward and one step back, as speed cannot always be front and center in a publisher’s mind. For example, the need to address the intensifying integrity issues across scholarly publishing has driven publishers to introduce additional checks along the workflow (often in haphazard ways) that typically slow down manuscripts.
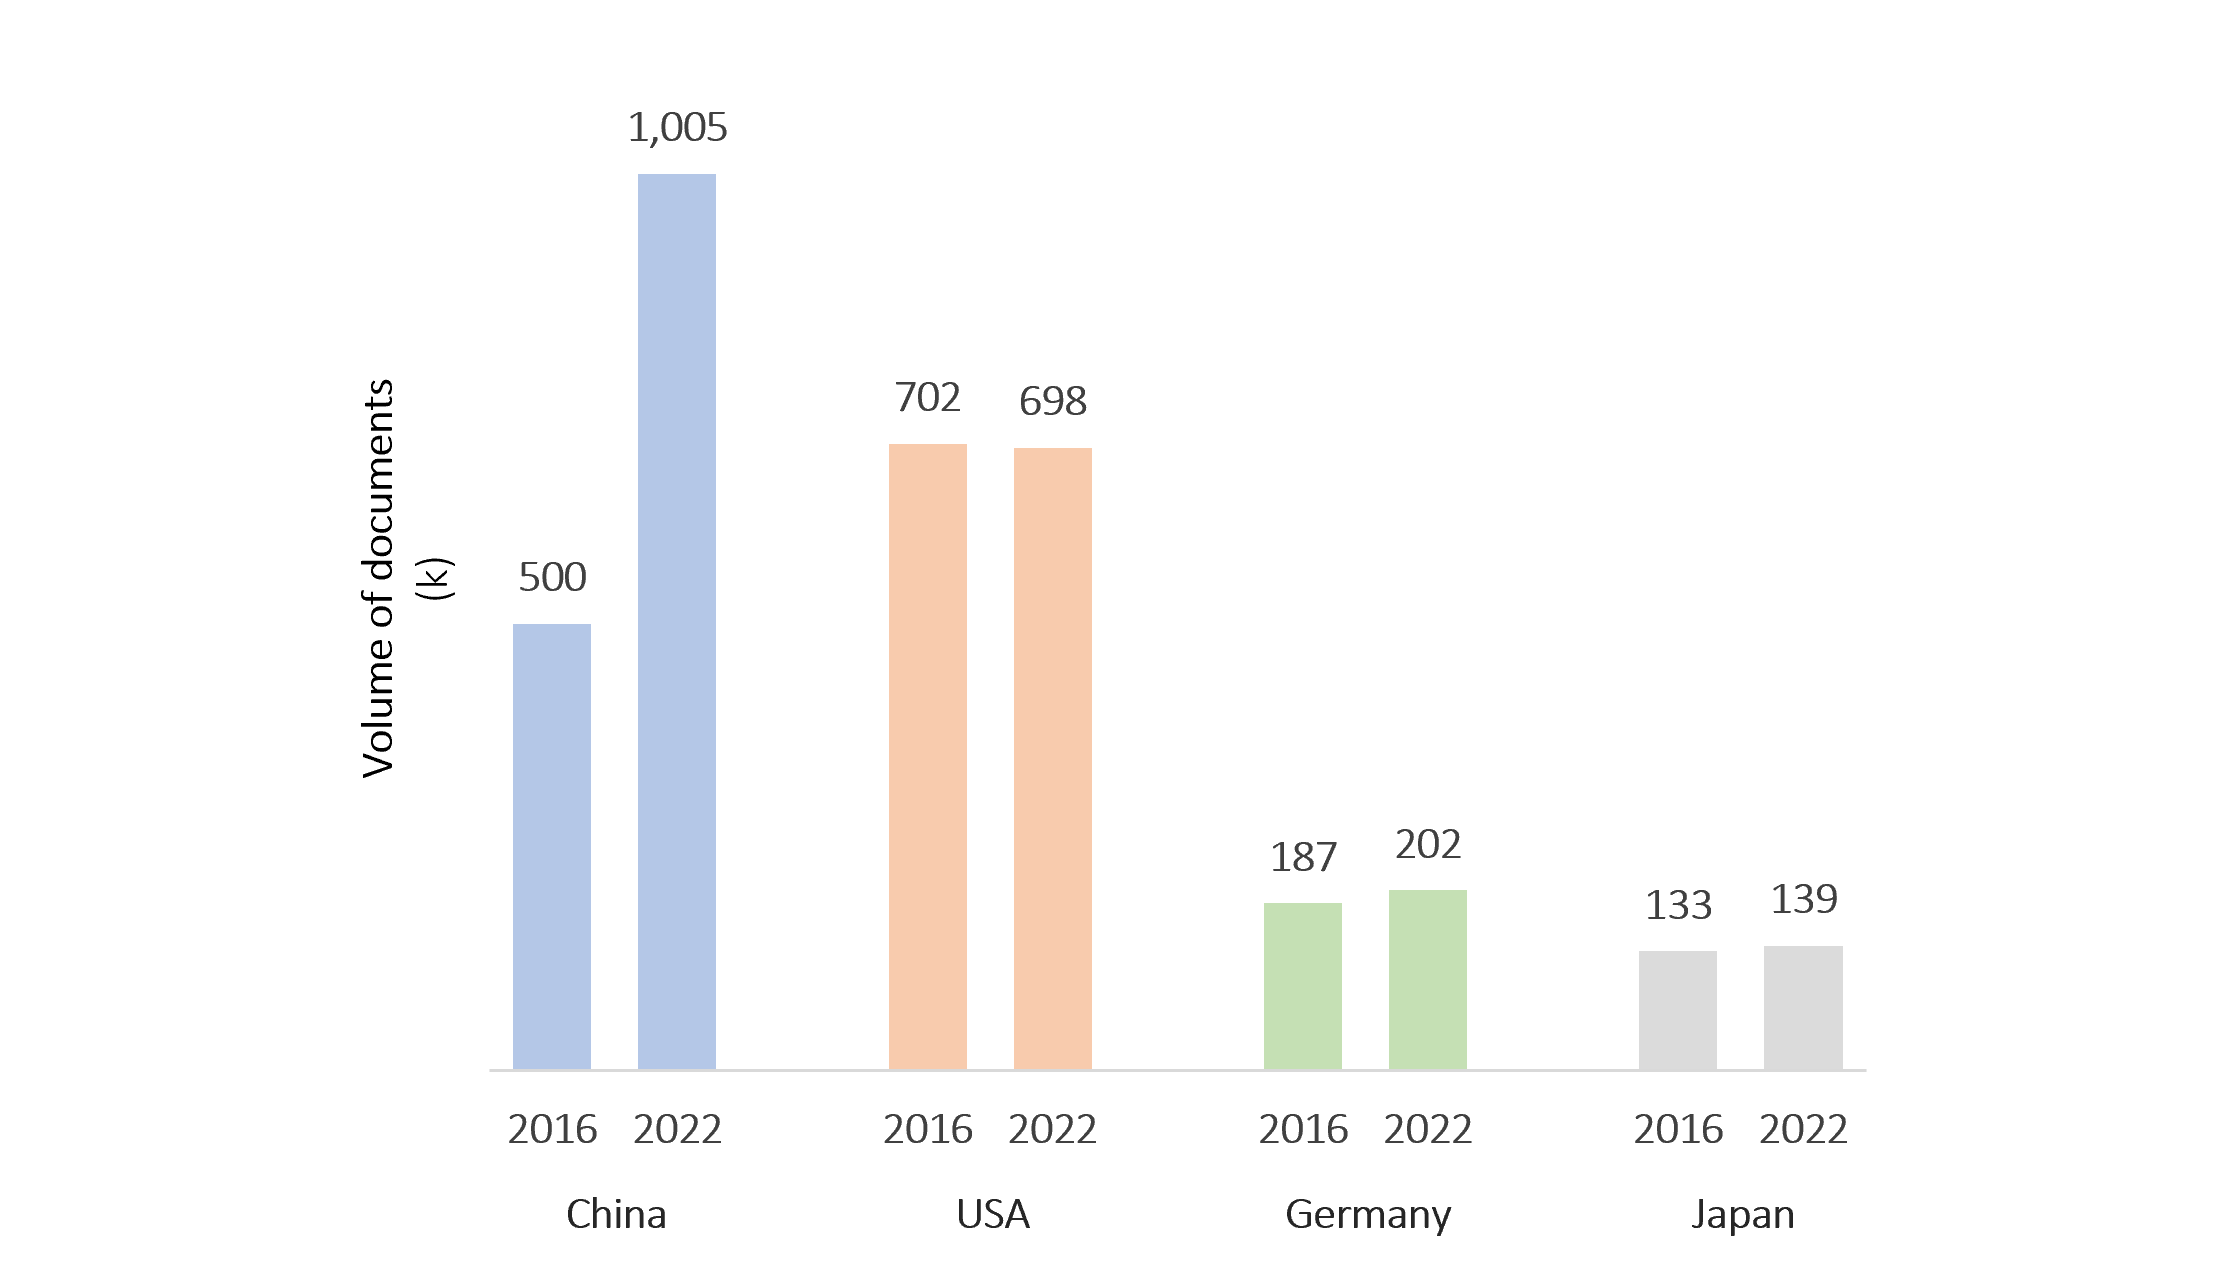
Other challenges have also emerged. For example, the over-supply of papers from China (it doubled its paper output to more than 1.0M from 2016 to 2022) has not been matched by the supply of editors and reviewers from China. Western journals typically favor western editors and reviewers, whose supply has hardly grown in recent years (e.g., the USA published fewer papers in 2022 than in 2016, around 0.7M). Overwhelmed editors and reviewers are likely to turn down manuscripts and lengthen the review process.
Informational transparency
When choosing where to submit their papers, researchers prioritize a journal’s reputation, its citability and ranking, and its readership (see old-but-gold surveys by Springer Nature, Taylor & Francis, and Editage). Speed and other journal characteristics come next. When it comes to citability, there are countless indicators that researchers can consider. To name a few, there is the almighty Journal Impact Factor by the Web of Science, the same-but-different CiteScore by Scopus, the quirky Altmetric by Digital Science, and the sophisticated SJR by Scimago.
When it comes to speed, researchers have relied on their personal past experiences or those of their fellow researchers, and on self-provided, incomplete, and non-standardized information by publishers. This means that researchers can find themselves disappointed when facing a peer review process that is lengthier than expected. Twitter has frequently hosted speed-related rants over the years.
I have long wanted to address this lack of informational transparency around turnaround times, and thus help researchers make better-informed decisions about where to submit their papers. For that purpose, I am hoping to partner with journal finder tools that can share speed information alongside other metrics and indicators.
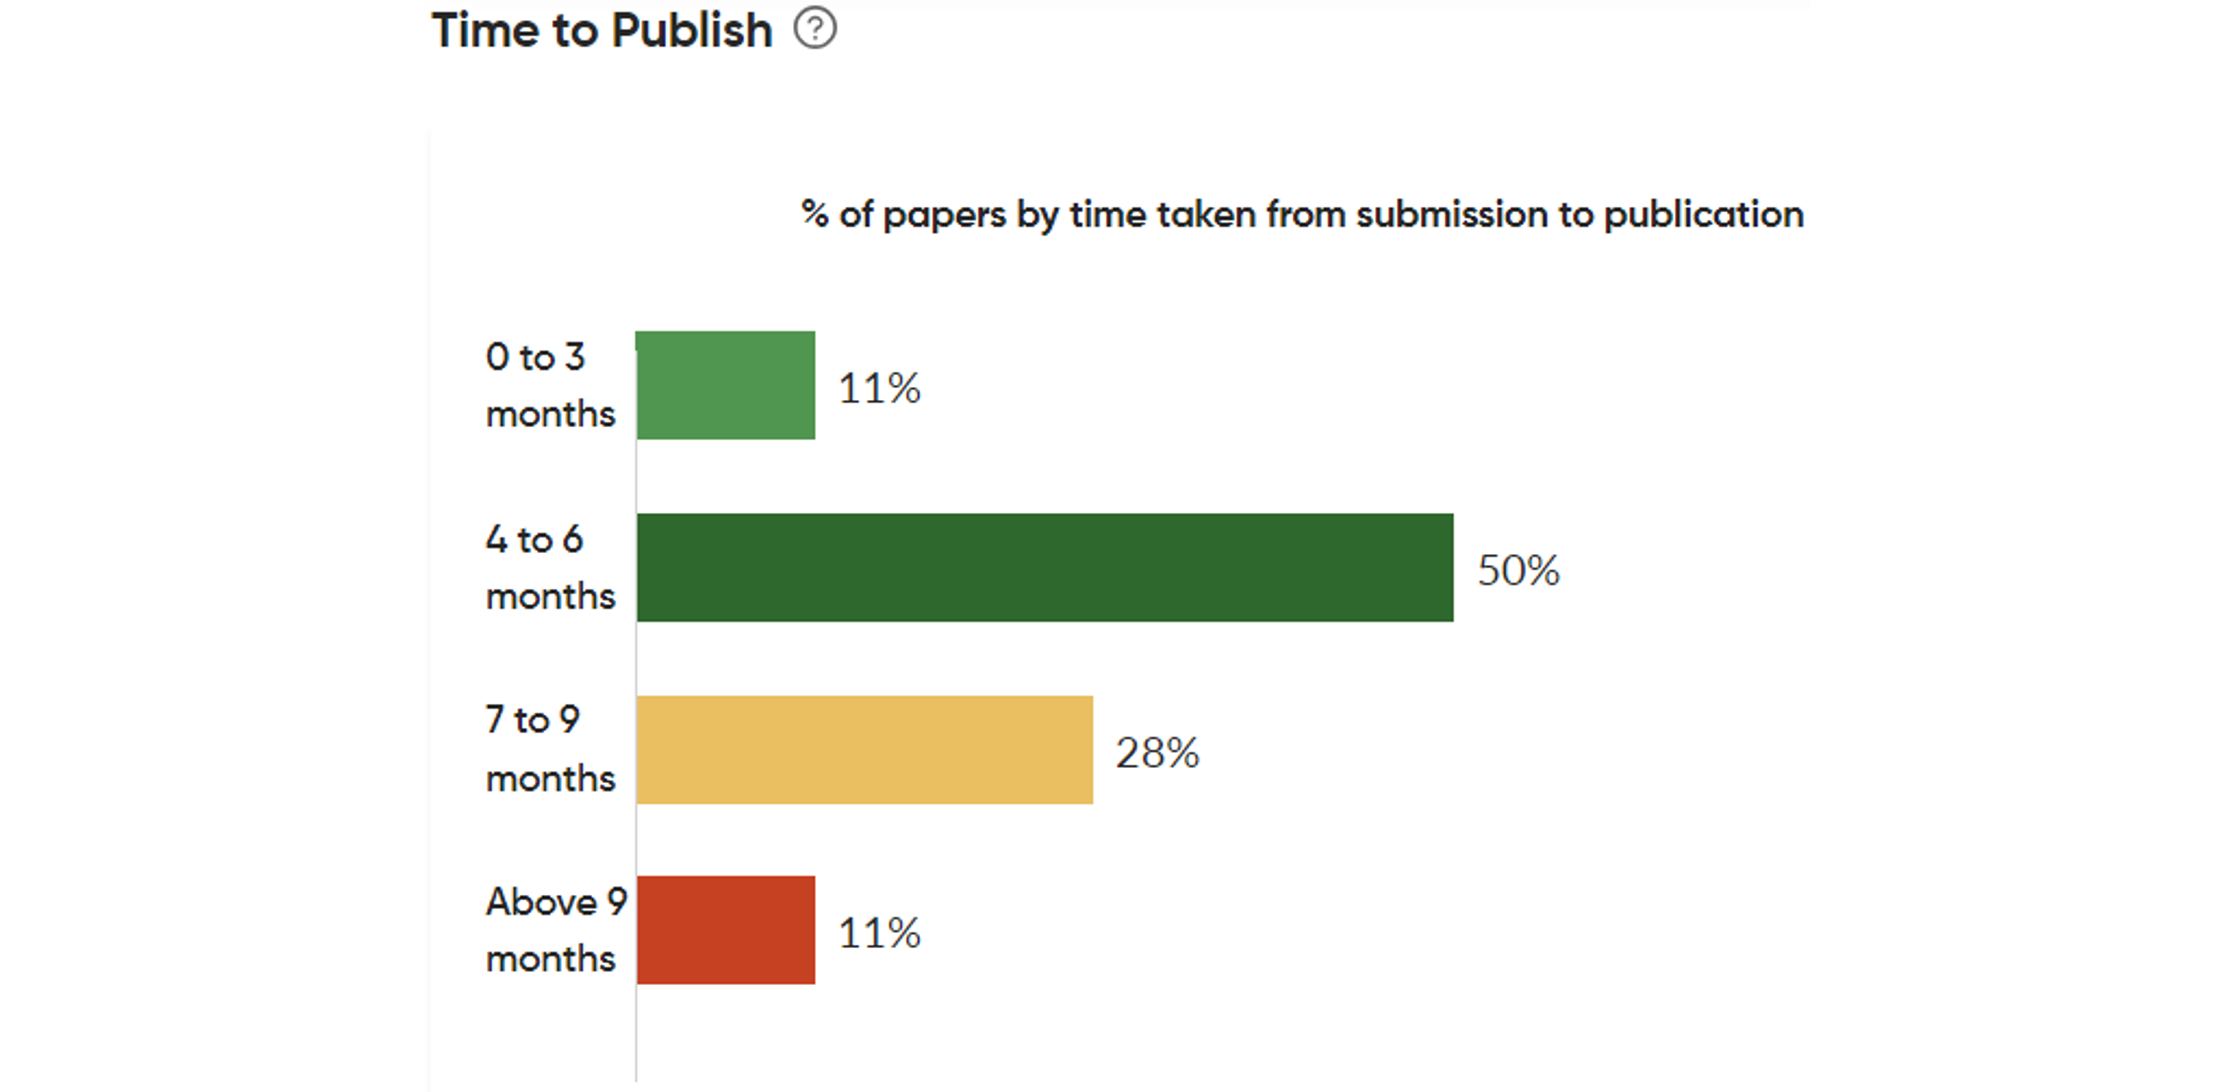
It starts with Researcher.Life by Cactus Communications. Its journal finder tool and dedicated journal pages offer a wealth of information. Now, speed information will be added to it for nearly 8,000 journals. Researchers may narrow down journals for their turnaround time to publish, and they can also see more details about a journal’s performance as in the screenshot below.
This is not about channeling researchers to the fastest journals (they could simply submit to MDPI if speed is their single concern). This is about helping researchers make balanced decisions and choose journals that are neither faster nor slower than they feel comfortable with.
Conflict of interest statement: My collaboration with Cactus Communications is for a three-month trial with no monetary or other rewards. Our goal is to assess the usefulness of turnaround time data for researchers. While we are not planning on a paid engagement, this may change in the future.
Discussion
13 Thoughts on "Guest Post – Publishing Fast or Slow: How Speed Varies for Similar Journals"
Thank you for writing this; great insights here!
Given that the issue at hand is more about the transparency of information, I also realized how different variables are popping up on journal websites regarding speed. For example, Springer Nature’s fast portfolio, Discover series, shares “Submission to first decision (median),” while a quick check on Elsevier journal websites revealed “Time to first decision” and “Submission to acceptance” as two separate variables. What are your thoughts on giving authors more insights, similar to the manner Elsevier chooses to do in this case? Are we heading towards choice overload bias? While I agree that fewer choices may result in authors primarily focusing on IF, which is something publishers actively try to move away from, spreading fragmented speed variables without clear guidance appears unhelpful to me.
Thank you for reading and commenting, Sena!
In my view, it would make sense for publishers to share three TATs: submission (defined as the first time an author clicked the submit button, not other timestamps of events occurring downstream) to revise decision, submission to acceptance, and acceptance to publication (first online publication of a full, citable paper).
Medians or averages can serve equally well. The inclusion of a distribution can be rather informative, but it can also lead to information overload (we show a distribution on Cactus’ journal finder).
Submission to first decision is misleading, because it blends early rejections pre-review with acceptances and rejections post-review. This way, it makes journals with high rejection rates appear faster than they truly are.
I was wondering if you’ve looked into any differences by grouping, for each research category, between open access journals and subscription-based journals?
Good question! All else equal (category, ranking, publisher), OA journals are slightly faster than subscription, because it is more likely that they have launched more recently and they have newer tech and workflows and less legacy slack. If you were too flip a subscription journal to OA, it would not get any faster. In fact, it may slow down because you are adding one more process, that of APC collection…
I’m interested in how you arrive at your conclusion that “selectivity is likely to be an excuse for a slow workflow rather than the true cause of a slow performance.” There appear to be a lot of assumptions inherent in that statement – for example, that the size of a journal’s staff and editorial board would grow linearly with the number of submissions they were expected to handle, which I suspect is not the case. Hyperselective journals have to sift through a lot of content to find the few articles they are going to publish, which takes time. When I started running middle-ranking journals 15+ years ago, I was very conscious of turnaround times and worked hard to improve them, and I’m sure that was the case in the vast majority of editorial offices even back then. There are lots of factors at play here, and the implication that it comes down to laziness or not caring seems wide of the mark.
By the way, I previously wrote a short article about the things that can slow down a journal’s performance, laziness not being one of them. https://www.linkedin.com/pulse/many-ways-academic-journals-become-slow-one-fix-them-christos-petrou
Hello Robin, the data suggests that well-ranked journals (except for hyper-selective ones) do not appear slower than lower-ranked journals. That’s the basis for my comment.
I have not come across a lazy or not caring editor or publisher before. But I have come across plenty that faced challenges to process papers in a timely manner. Understaffing and poor workflows are some of the causes of a slow performance. Selectivity has little to do with that.
That’s certainly an interesting observation that might be worthwhile testing – is there (as you appear to be assuming) a linear relationship between the degree of selectivity and the amount of work involved? Or is it possible that there is a breakpoint in that relationship at high levels of selectivity that accounts for the drop-off in processing times?
That’s what I tried to convey with Figures 3 & 4 (hopefully I’m not misunderstanding your statement here). I’m not sure what the cut-off is, but it appears that the top-5% of journals tend to be slower than the rest of journals. I think that’s the case broadly in STEM, as shown in the example of Biochemistry.
I also don’t think that hyper-selective journals are slower by virtue of being selective. Their slow performance is more likely the result of a more rigorous review process and additional checks in comparison to other journals. If you’re going to publish cutting edge research that will move the world forward, you might as well make sure that it has been checked several times in all possible ways.
Thanks for the clarification Christos – I think we’re basically saying the same thing, but I would include “a more rigorous review process and additional checks in comparison to other journals” as part of the process of being more selective. Are there journals that are hyperselective but _don’t_ have a more rigorous (and hence more time-consuming) review process?
That sounds right. In theory, you can have hyper-selectivity without the additional checks, but in practice it doesn’t make sense to have the one without the other.
Great article, as always, Christos. Transparency is always a good thing, although there are some significant challenges in interpreting turnaround time (TAT) data across publishers.
I’d be interested to hear your thoughts on what the unintended consequences of this initiative might be. Is it possible, perhaps even likely, that some publishers would game the system by rejecting papers after review, while strongly encouraging a brand new submission that addresses the referees’ comments? I suspect that this already happens for some papers that need “major revisions”.
To make the data truly useful the TATs need to be accompanied by information on the number of rounds of review. Taking 180 days to publish a paper after one round of review is a very different proposition from reviewing the paper three times in that period. This information is generally not available publicly, but it should be. Transparent peer review would help in that regard.
As much as I would like to see more granular data on TATs across publishers (e.g. submission to first decision, first decision to final decision, acceptance to publication etc), I can’t see how this would work in practice. For example, I had an email conversation with a publisher recently where we came up with three different definitions of “submission to first decision”. Getting publishers to agree on a common terminology would be very hard; getting them to consistently apply those definitions would be nigh on impossible.
Hello James, in my experience, most publishers and portfolios use submission dates that are close to what I would consider the true submission date, i.e., the first time that an author hits the ‘submit’ button for a paper that in their view is complete. More broadly, definitions for timestamps are aligned adequately well to allow for comparisons.
There are some portfolios that have a fundamentally different approach for the submission date, such as using the date of a returned revision. I think this is rather uncommon and easy to identify (e.g., by comparing the timestamps of the paper against those of preprints) and address. For example, I am not sharing results for the Advance portfolio of Wiley because it applies that practice and appears faster than it is.
Regarding revisions, it is true that at the paper level, the time for revision can introduce variation and delays, independently of the in-house speed of a journal. However, this should matter less at the journal level, unless there are journals that systematically ask for lengthy revisions or hardly any revisions. Differences at the journal level are likelier to reflect differences of workflows and in-house processing capacity.
I know that your feedback comes from a good place. And I am sure there are plenty more holes to pick on. Nonetheless, while this information might be imperfect, it is also good, and hopefully it can benefit researchers.