The title of this post is not the most kind or supportive headline you’d expect from The Scholarly Kitchen these days. Nonetheless, it’s the most succinct summation of everything that will follow in this blog post. So, if you want to skip a nuanced discussion about statistical methodology, bad data, and narrative spin, let’s just leave it at that. This paper is fatally flawed.
But it is also the best paper that I’ve read in some time that attempts to seriously answer the question of whether preprints matter, and is guaranteed to generate some headlines, which is why I’m coming out of my blogging hiatus.
“The enhanced research impact of self-archiving platforms: Evidence from bioRxiv, (JASIST, 16 June 2024)” by Hongxu Liu and others at the School of Public Economics and Administration at Shanghai University, is an exceptional paper that rises above the rest. It is still fatally flawed and oversold; nevertheless, it offers a few lessons about how (not) to conduct X-causes-citations research and what (not) to say in a paper.
“Similar” means something in statistics
A lot of analysis in statistics is about comparing similar groups. The best way to achieve similar groups is through a random assignment process, where the thing you are studying (people or lab rats or academic papers) are randomly assigned to separate arms of the experiment. In the most basic assignment, there are just two arms: the treatment group and the control group. If the randomization process is successful, then the treatment and control group should be similar in all respects at the start of the experiment. If a difference between the two groups is discovered by the end of the experiment, there is strong evidence to suggest that the treatment itself was the cause. A lot of biomedical research is conducted this way. These studies are very difficult to set up but much easier to interpret.
In cases where it is difficult (or impossible) to control the experiment, the researcher just observes and attempts to draw some causal relationship between a possible cause (e.g. manuscript deposit in a preprint server) and outcome (journal citations). In this case, the assignment of papers to each arm of the study is outside the control of the researcher, which means that it is a lot more difficult to identify the probable cause of any observed differences, especially if the two arms of the study are dissimilar. A good researcher will tread carefully here, systematically investigate other likely causes, and remain hesitant when it comes to ascribing cause and effect. In the case of citation analysis, there are many reasons why a paper may be cited; deposit in a preprint server is just one possible cause.
The failed attempt to construct a similar control group
In the Liu study, the main comparison was the citation performance of journal articles that were deposited in bioRxiv (the treatment group) against a group of “similar” published papers (the no preprint control group. Note: We don’t know if these papers were deposited in any other public archive.) Control papers were identified by using PubMed’s text-mining algorithm, which was developed to find related papers based on keywords. Control papers had to be published in the same year in a journal with a similar Journal Impact Factor. A similar paper, however, could include a Review, Letter to the Editor, or Editorial Material. Yes, I wrote “Letter to the Editor or Editorial Material.” This means a research paper in the study group could be keyword matched with an Editorial written about the same paper, a Letter to the Editor critiquing that paper and the author’s reply. The researchers’ table describing their dataset seems to confirm that constructing a similar control group failed even before they began analysis. This didn’t stop the researchers from using the word “similar” to describe their control group 19 times in their paper. These papers aren’t similar.
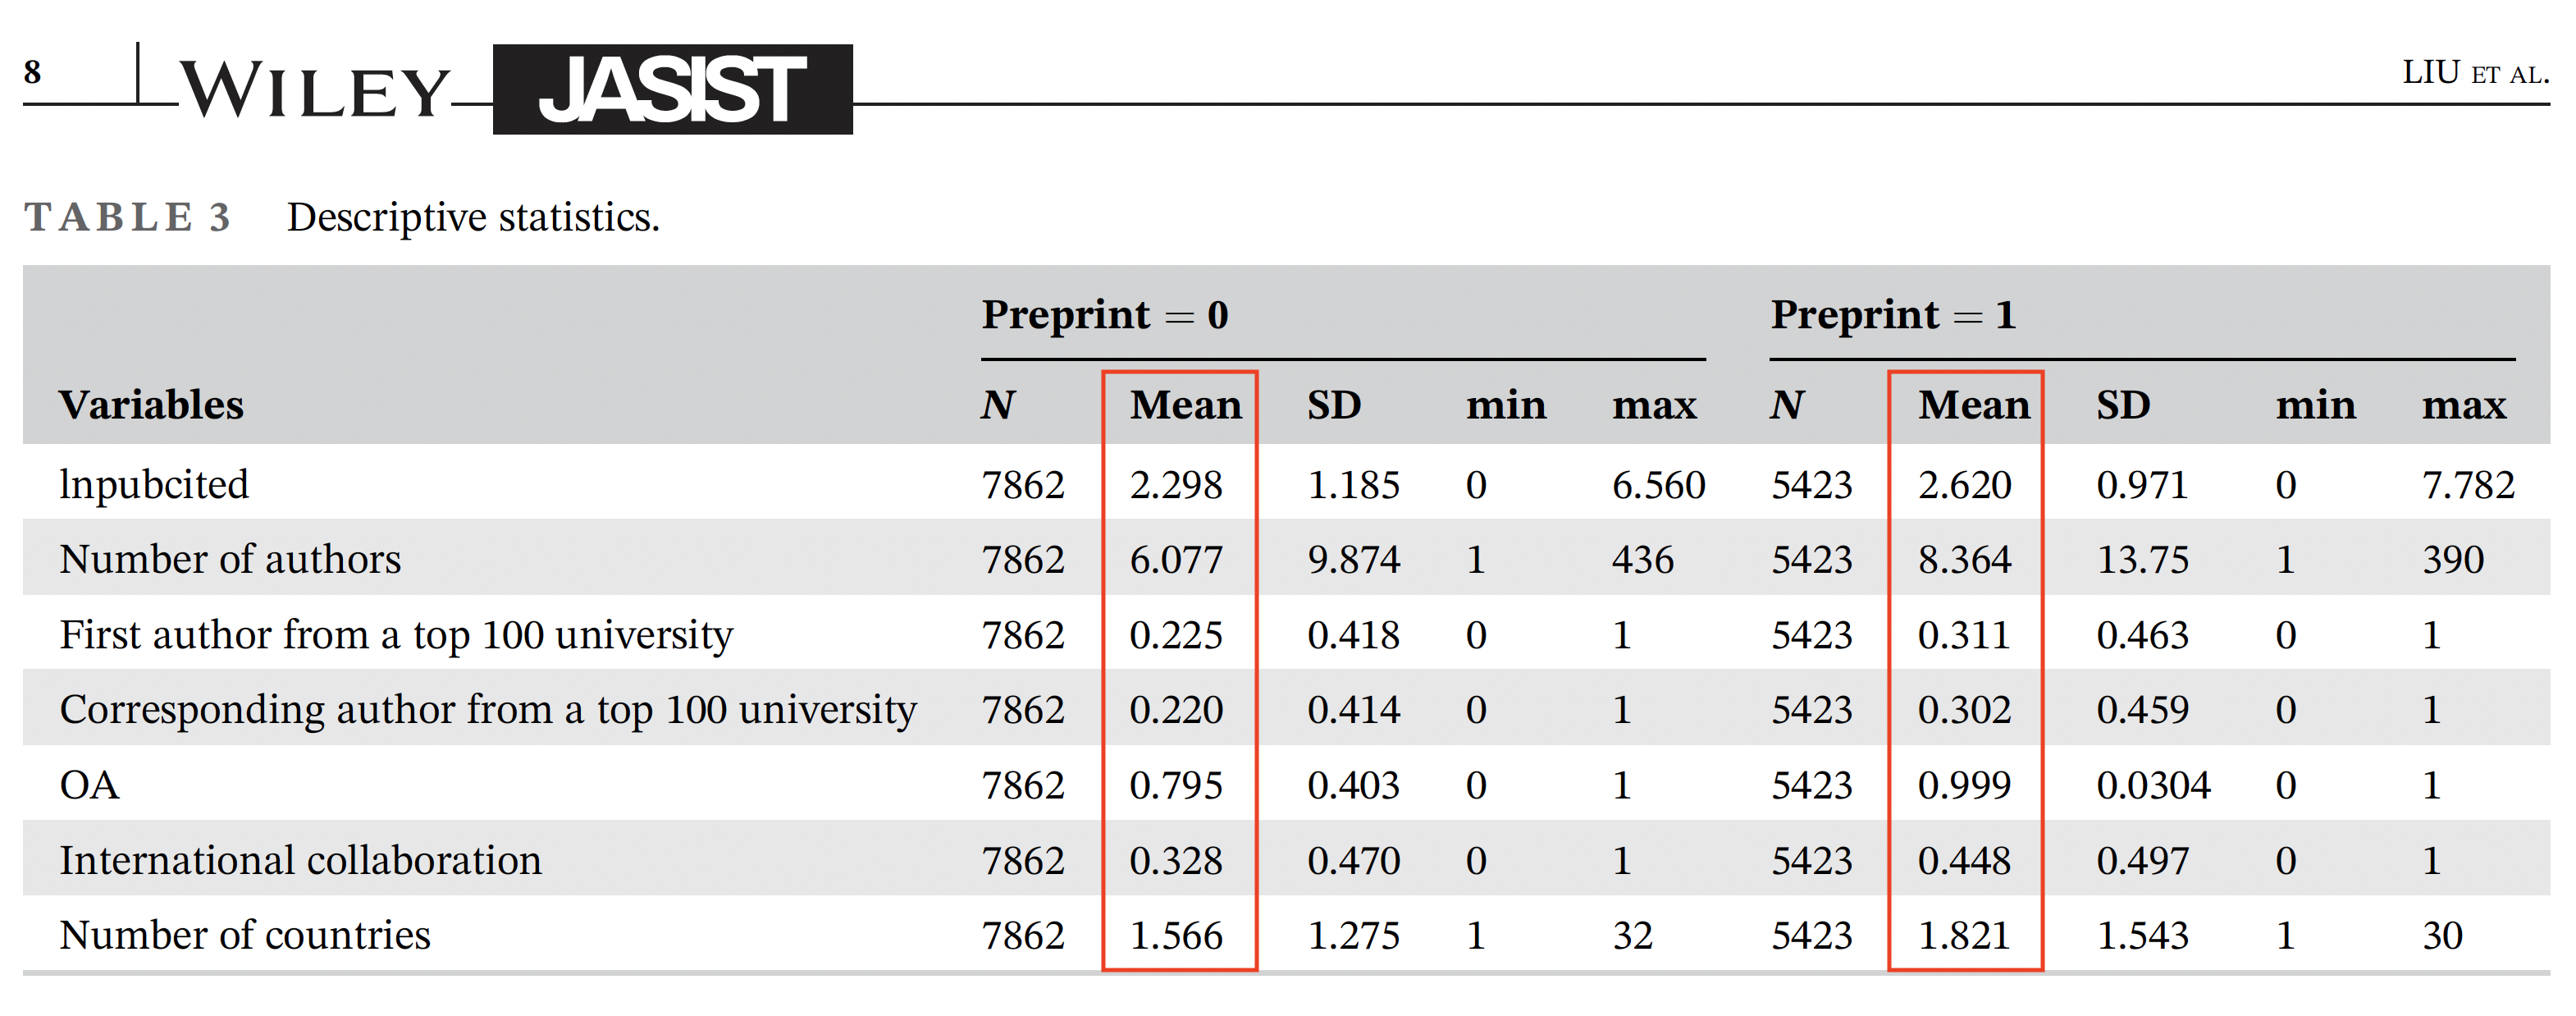
Indeed, the treatment and control group are very dissimilar. Papers deposited in bioRxiv have more authors, authors that reside at top universities, published open access (OA), and involve more international collaborations from more countries. All of these variables are known to predict article citations.
What is missing from this table (and accompanying text) are statistical comparison tests alerting the reader just how dissimilar the bioRxiv set is from the control set. What is also missing from this table is a Journal Impact Factor variable, which would alert us whether the set of treatment and control papers are published in journals that perform differently. The authors have these data and report them in their linked dataset. Also missing from their table is a variable specifying article type.
Show me the data. Wait. Maybe not!
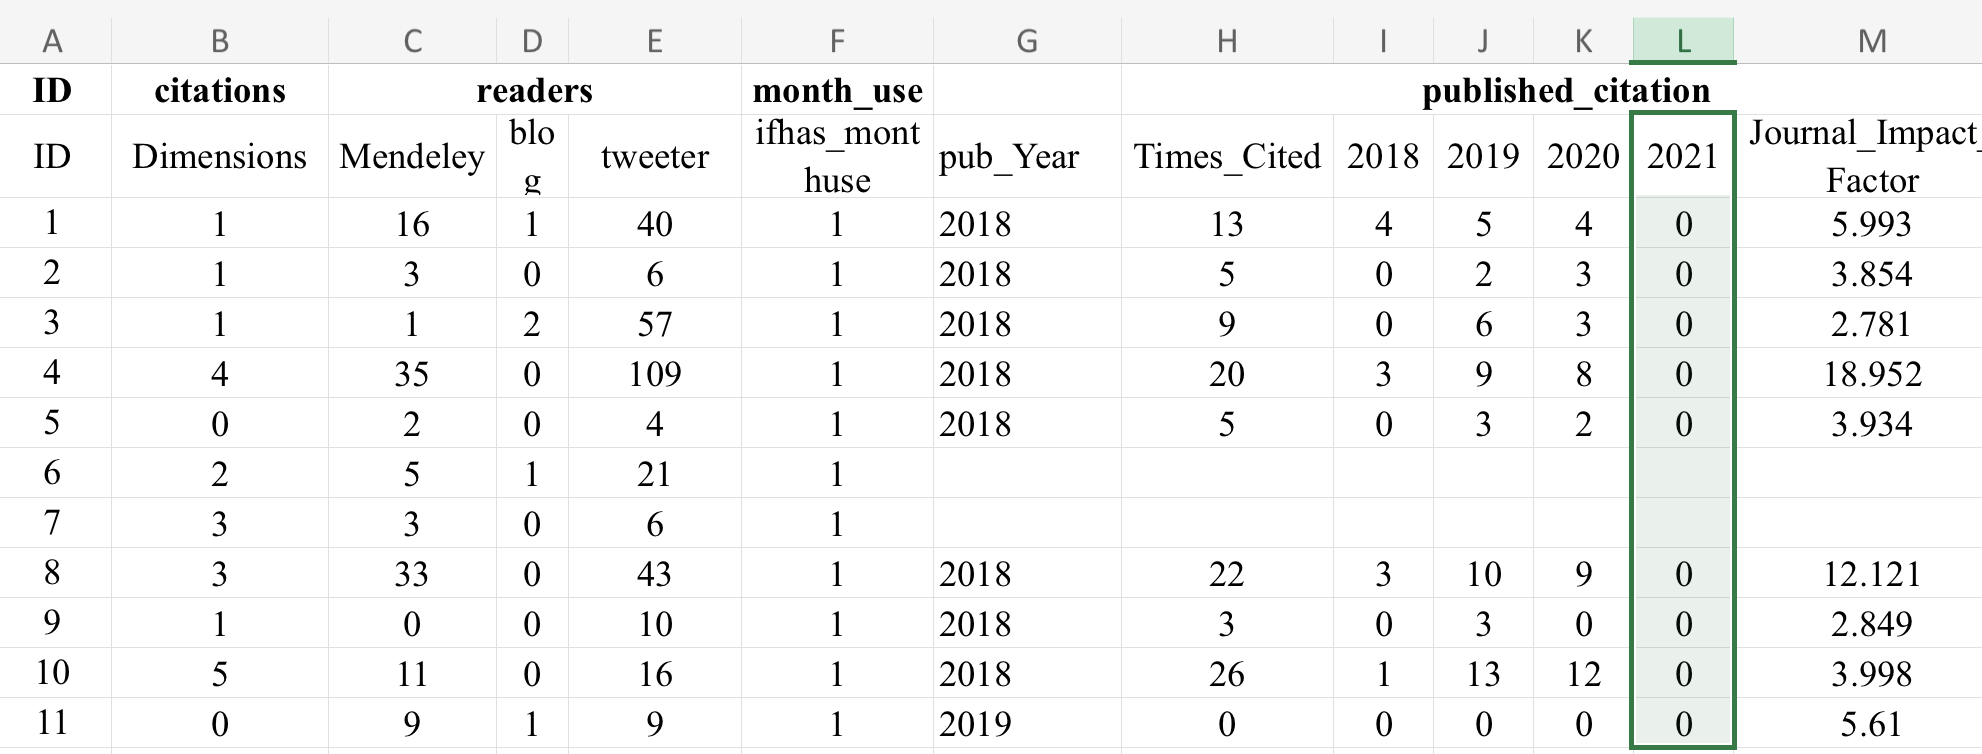
I was encouraged to see that the authors provided a linked dataset, but the authors did everything they could to strip any identifying information that would allow a reader to validate their results. Article titles, journal names, and even DOIs were stripped from their dataset. It is impossible to even know which paper was in the preprint or control group.
Even more strange is a string of zeros in the column reporting article performance in year 2021. I have asked the corresponding author for a full dataset and explanation for the 2021 citation column but have not yet received a response.
Fancy statistics can only take you so far
In spite of repeating their claim of constructing a “similar” control group, Liu and others appear to understand this is just plain false and proceed to construct six statistical models, each attempting to come to a more “accurate and unbiased result.” Their most basic model estimates that bioRxiv increases total article citations by 32%, but their more elaborate model reduces this effect to just 19%. Somehow this latter result is used to spin an argument that they have arrived at a more accurate citation benefit estimation than previous researchers. In reality, the only findings that the authors can state with any confidence is that their attempt to construct a set of similar control papers failed and that unrelated variables (number of authors, prestige of author university, OA status, and international collaboration) can explain a lot of the citation difference. To ascribe the remaining effect to bioRxiv is merely a conjecture — at best.
What can be learned from this paper
I’ve spent a lot of words undermining the integrity of this paper, its results, and perhaps even the peer review process at JASIST (did anyone even take a cursory look at their dataset?) Still, the paper provides a teachable moment, even if some of the lessons are what not to do.
- There is a long history of preprint research that dates back to the early 2000s. Before bioRxiv, all eyes were on arXiv, the granddaddy for author-deposited manuscripts.
- There are many, many attributes that predict citation, preprint platform is just one of them.
- Isolating a single effect in an observational study can be extremely difficult. This is especially true in citation analysis where causes and effects are often confounded.
- Lastly, be aware of bias. Our personal experience and worldview of publishing may affect how we interpret our data.
Paradoxically, Liu’s paper is not found on bioRxiv, but was deposited in ResearchGate on June 17, the day after journal publication.

Discussion
9 Thoughts on "bioRxiv and Citations: Just Another Piece of Flawed Bibliometric Research?"
I’m gonna assume that “Pride and Prejudice” and “Pride and Prejudice and Zombies” contain a lot of similar keywords. Does that mean they’re pretty much equivalent books?
The linked dataset contains 19812 lines (articles) and 11697 of these have publication years (2018, 2019 or 2020). It seems that articles published in 2021 were not included in the data. According to the endnotes: “All data acquisition time is as of October 2020.” and “Note that the dependent variable is the natural logarithm of thenumber of citations up to 2021.” It is most likely that these 19812 articles are those which were found in bioRxiv in the beginning of the creation of the treatment group: the preprints posted on bioRxiv in 2018 (“We collected a total of 19,813 articles deposited on the bioR-xiv platform between January 1 and December 31, 2018.”). Apparently, the articles which were fetched from PubMed with the PMRA matching algorithm are not included in this dataset. So, in this form it doesn’t really matter if the DOIs are included or not, because the dataset doesn’t include the articles from the control group. Another interesting thing, that the three most cited articles (IDs: 10033, 15236, 4270) were unpublished preprints according to this dataset.
Thank you for a closer look at their dataset. My confusion about what these authors actually did may stem from several reporting contradictions found in their paper:
“we use the number of citations in the publication year and in each of the next 3 years after publication” (Section 3.3)
If they are limited to papers published in 2018, this would mean citation data for 2018, 2019, 2020, and 2021.
And in Table 2, they define their variable lnpubcited(t+3) as “the natural logarithm of citations in the third year after publication.” This also means that they collected full citation data for 2021.
Indeed, in Figure 3, they report a distribution of citations in year 3.
However, their endnote reads “All data acquisition time is of October 2020,” which means that not only did they fail to gather full citation data for t+2, but that might explain why t+3 is largely a set of zeros and a few ones, which implies that they gathered the data, otherwise, this column would be a set of empty cells.
On closer inspection, their work looks worse than I originally surmised. Thank you for contributing to the discussion.
It is possible that “All data acquisition time is as of October 2020.” only applies to Altmetric data and/or bioRxiv data, and they indeed have full Web of Science citation coverage from articles in 2021, although it is not clear from the text. The dataset includes two types of citations: “citations (Dimensions)” and “Times_Cited” (“published_citation”). The latter is the sum of citations from 2018+2019+2020, so it is possible that the authors just forgot to include 2021 in the dataset. It is also interesting that the correlation between Dimensions and Web of Science citations is pretty low. The high citations numbers for unpublished items are from Dimensions (these of course have no Web of Science citations).
Whatever method they followed, their text, tables, figures, and dataset are inconsistent with each other. And this didn’t happen just once in the paper. At best, we can call this paper sloppy and question the veracity of their results. At worse, we can question their intentions, but in the end, their results are still not trustworthy.
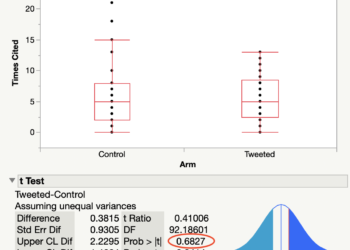
I’m curious to learn, what other “statistical comparison tests [can] alert the reader just how dissimilar the bioRxiv set is from the control set.”?
Simple tests to compare the means (e.g. t-test), or non-parametric test (e.g. Mann-Whitney) if the distributions are skewed. You can look these up and see how they are reported in a good journal.
One potential route would be to compare preprint and non-preprint articles from publishers/journals (e.g. PLOS) that allows authors to post a preprint just by checking a box during the submission process. There would need to be a filter for preprints that were posted by the authors before submission as these authors might be more diligent & more into open science than the remainder. This setup controls for publishing journal and (to some extent) author motivation and ability.
Even better, there could be three arms of the study: 1. author deposit; 2. publisher deposit; and 3. no deposit (control). The difference between 1 and 2 may shed more light on how self-selection affects author motivation and behavior.