At the end of 2024, SSP launched its (first-ever) Compensation and Benefits Benchmarking Study, an annual global benchmarking survey focused on gathering information on wages, compensation, benefits, policies, and skills from individuals working in scholarly communications and the organizations that employ them.
While the window for submitting 2024 data is drawing to a close (March 31), there are already just over 300 responses for the individual study. We have made reporting available now that we have a sufficient number of data points to provide meaningful comparisons. Reports are dynamically generated, so as more individuals complete the survey, more comparison data will be available.
Reporting for the organizational study will be released at the end of March to allow more organizations to participate. The deadline for organizational participation is also March 31, 2025. We would benefit from more organizational data, so please encourage your HR staff to participate.
General areas that are included in the individual study include education, experience, work satisfaction, compensation, healthcare, retirement plans and additional benefits, paid time off, and the specific skills that are most important and emerging for positions in scholarly communications.
I’ve pulled out a few data points from the survey to demonstrate who has participated so far and some findings that I found interesting.
Participant Profile
Ninety-five percent of individual respondents are employed full-time. The majority live in North America (71%) with 68% residing in the US. Europe and Central Asia are represented by 27% of respondents (20% located in the UK). Two percent (2%) reported East Asia and Pacific as their region of residence.
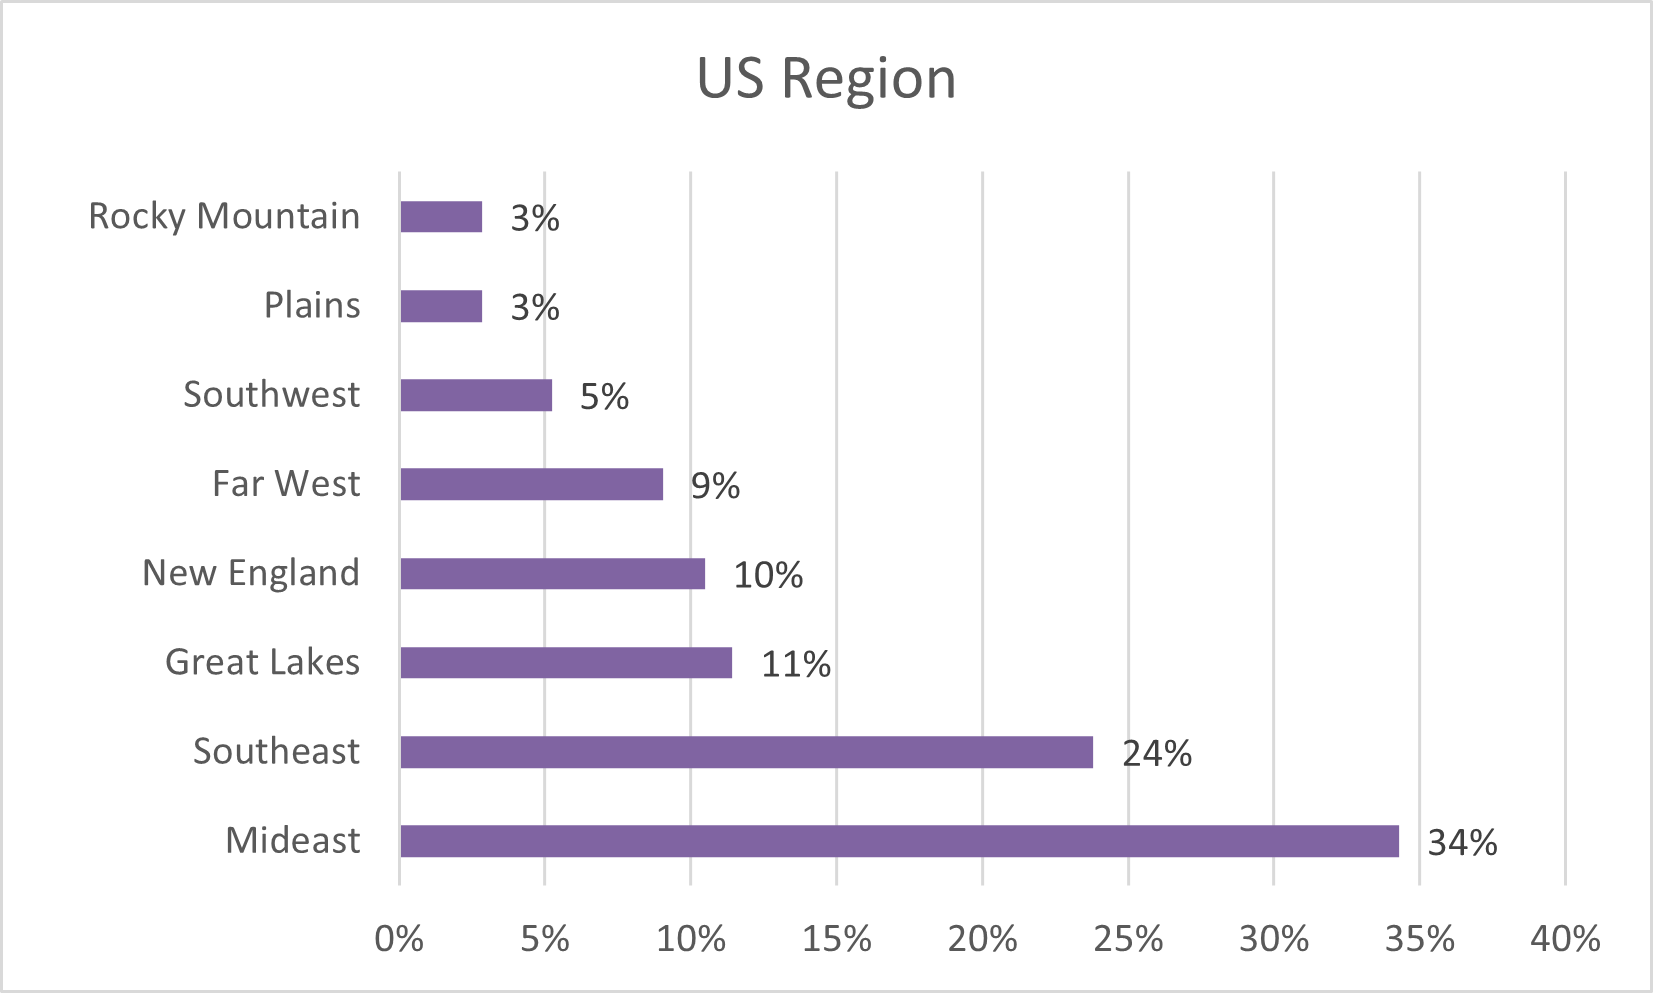
Looking at the US distribution (as defined by the U.S. Bureau of Economic Analysis), publishing professionals are definitely more concentrated in the East (nearly 70%) with the Mid-East (NY, PA, MD, DE, NJ, MD, and DC) having the highest number of respondents (35%). The Southeast is also well represented with 24%, followed by New England at 10%. The rest of the US including the Far West, Southwest, Plains, Great Lakes, and Rocky Mountain regions account for only 31% of respondents collectively.
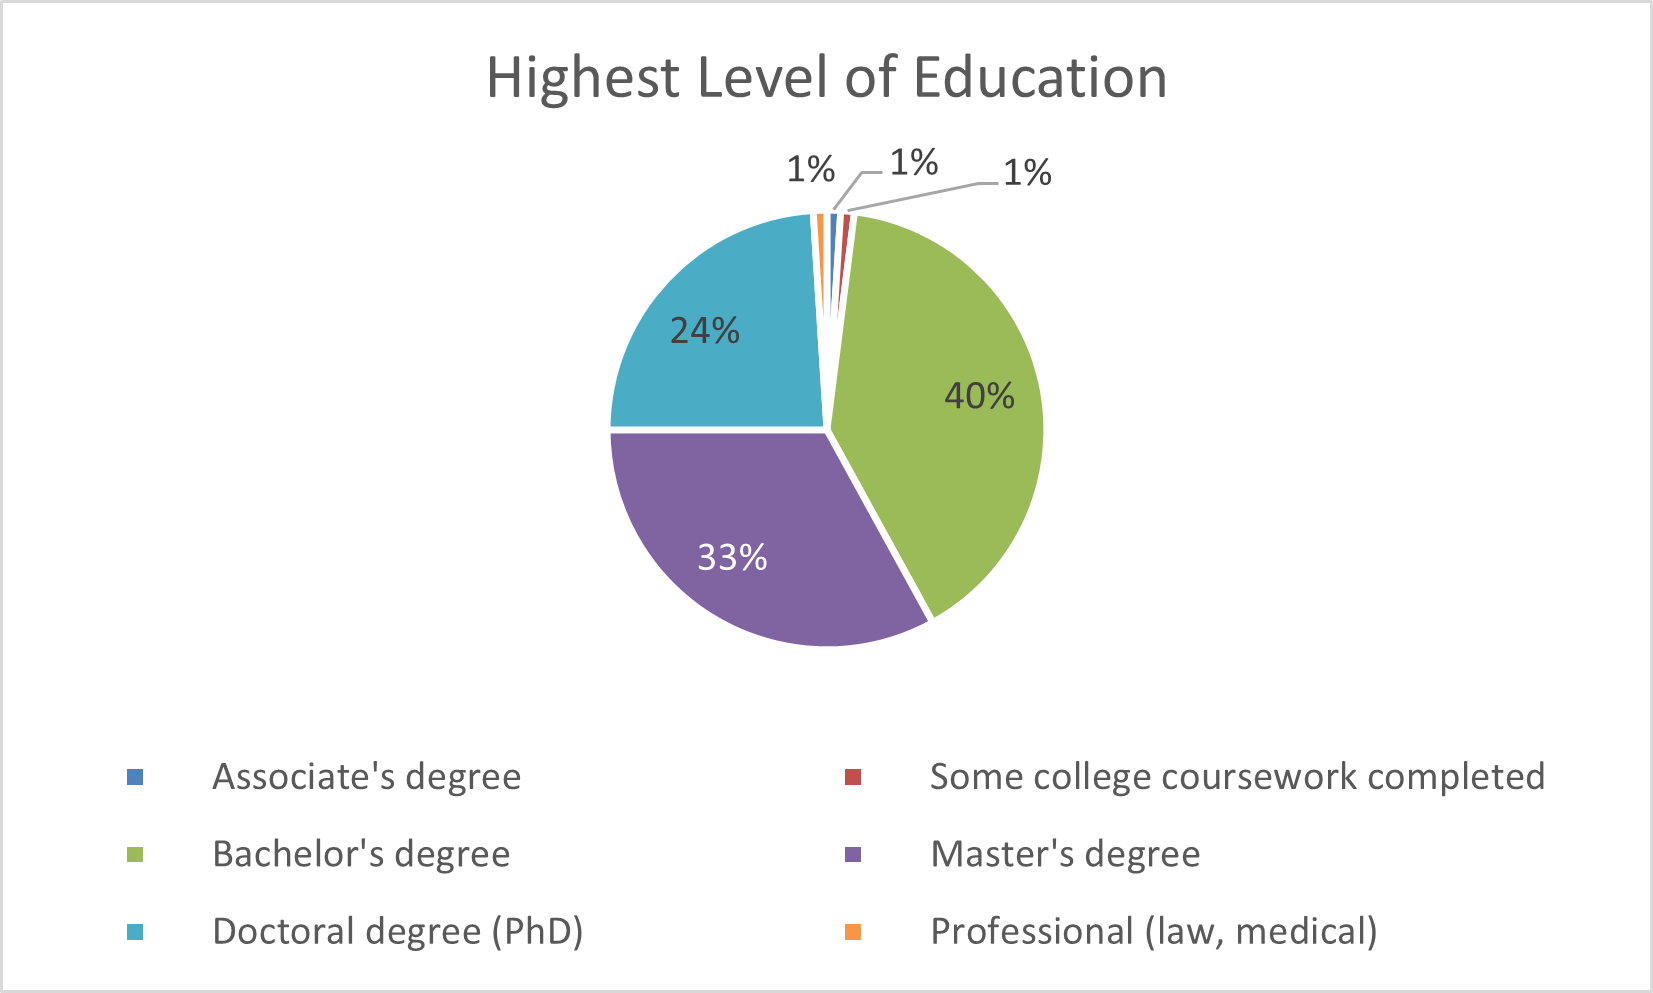
It comes as no surprise that scholarly publishing professionals are well-educated. Ninety-eight (98%) of respondents hold a bachelor’s degree or higher with 33% having earned a master’s degree, and 24% have PhDs.
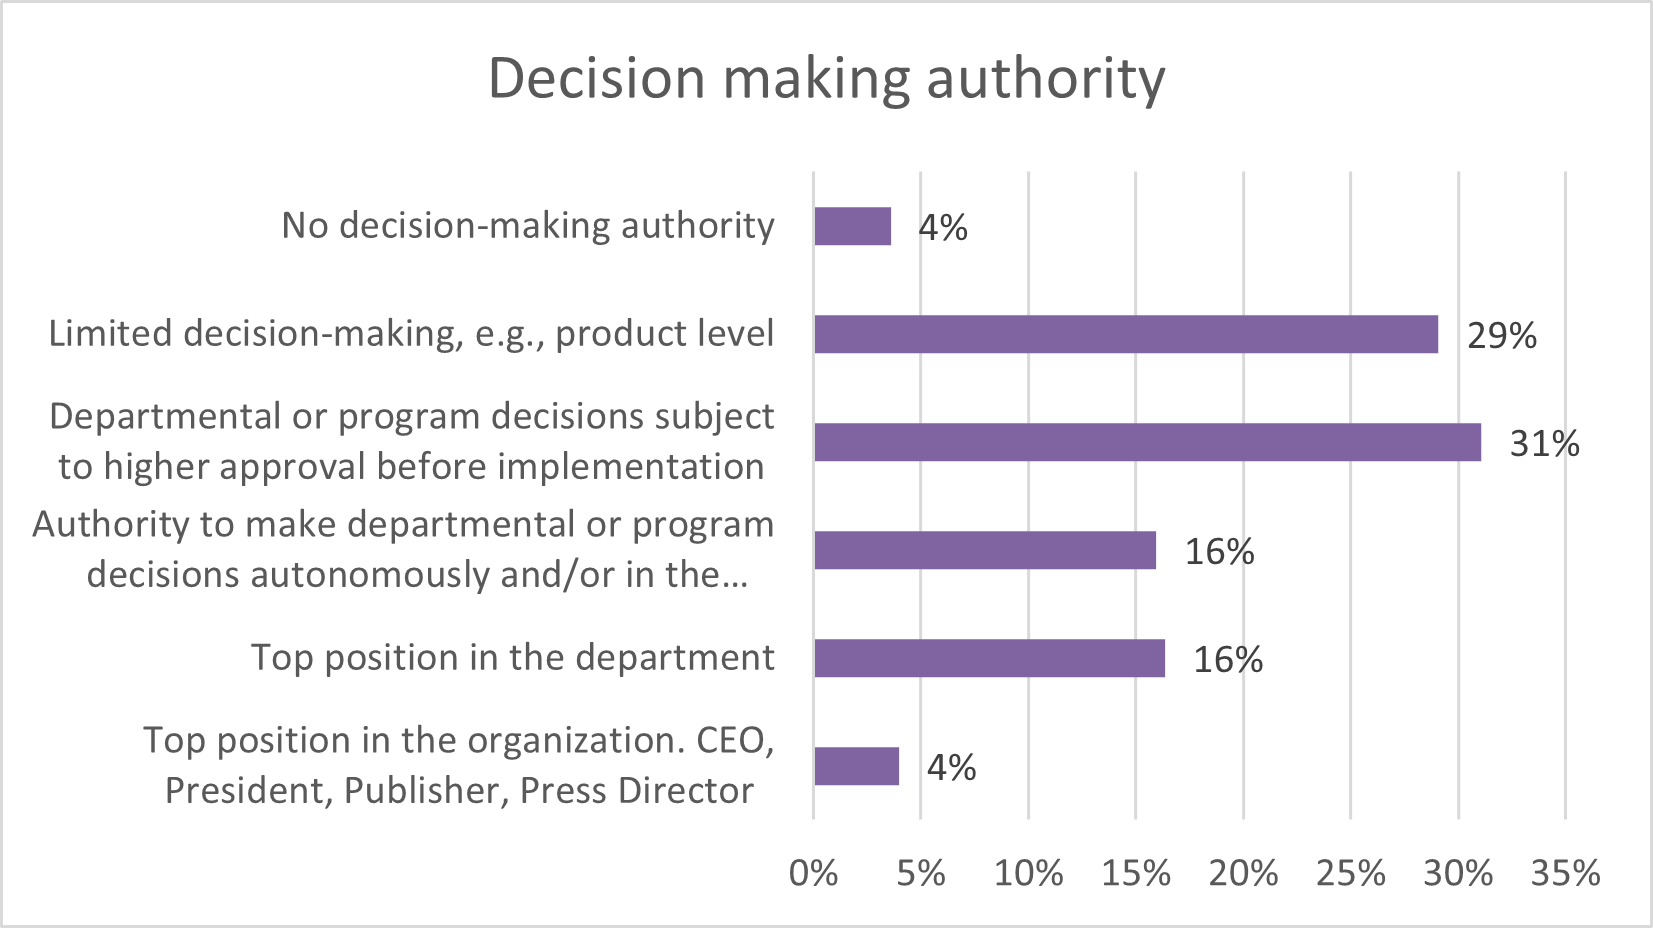
The study includes a nice cross-section of positions according to decision authority. Those with no decision-making authority and those with ultimate decision authority make up the smallest groups represented. Most respondents have at least some level of authority to make decisions at the departmental or program/product levels.
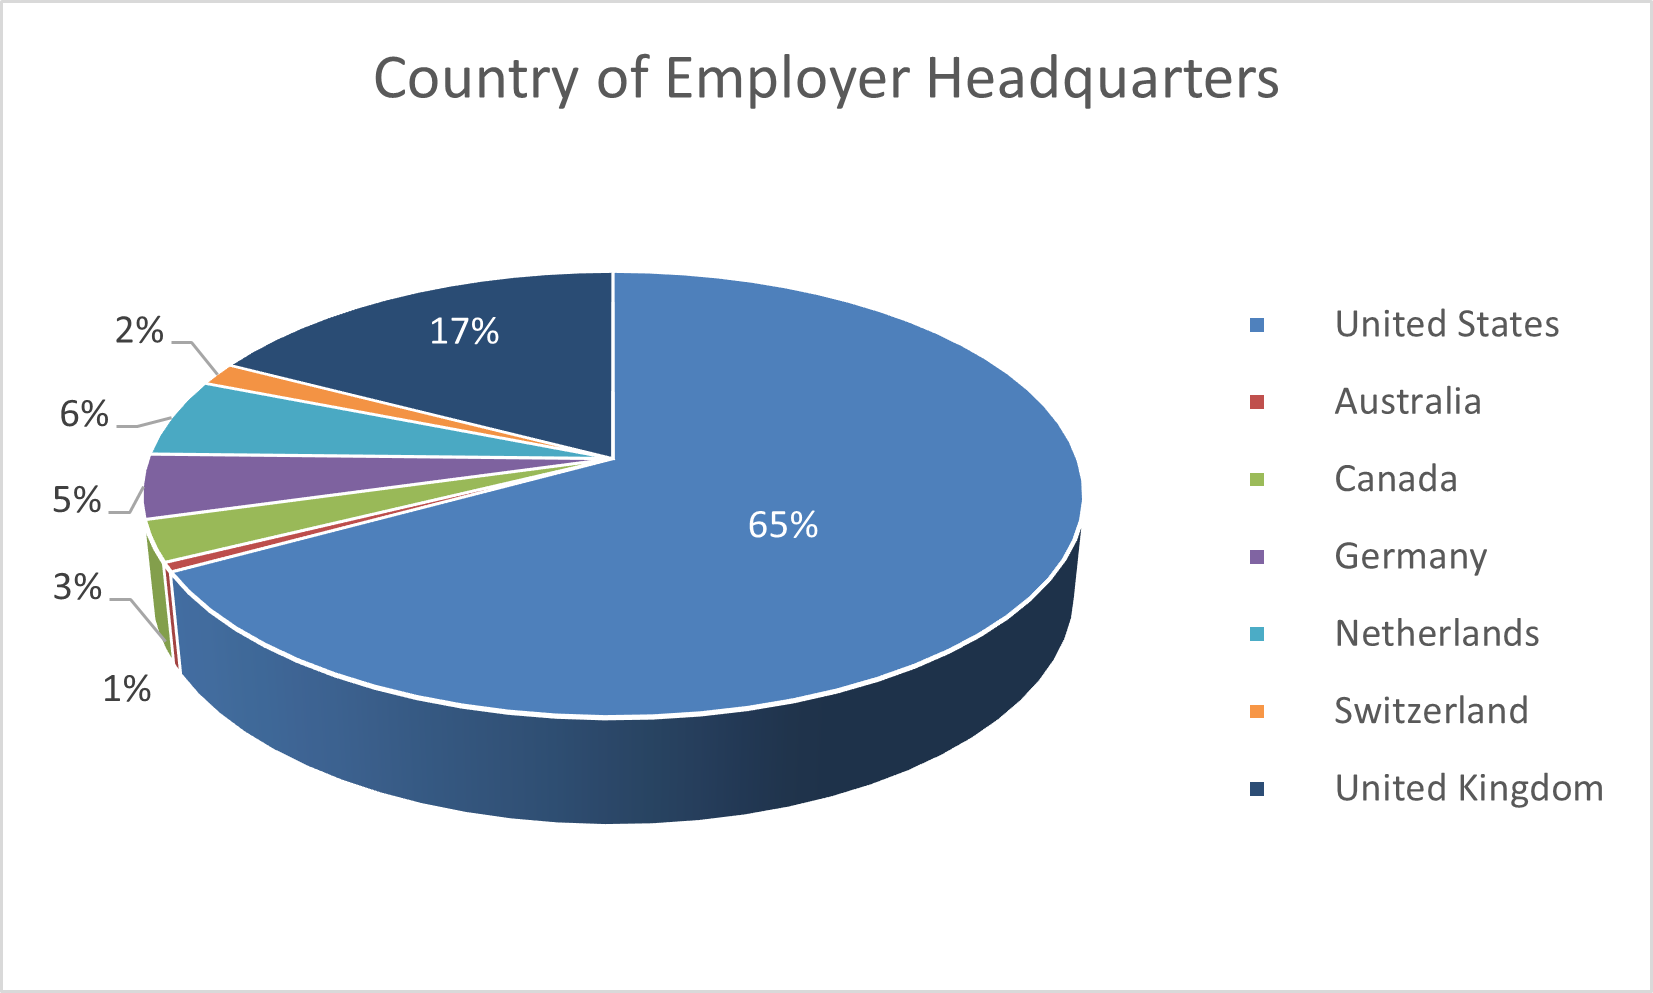
Where employees live is not necessarily reflective where their organizations are headquartered. The US (65%) followed by the UK (17%) are the countries most frequently reported as the location of their employer’s headquarters.
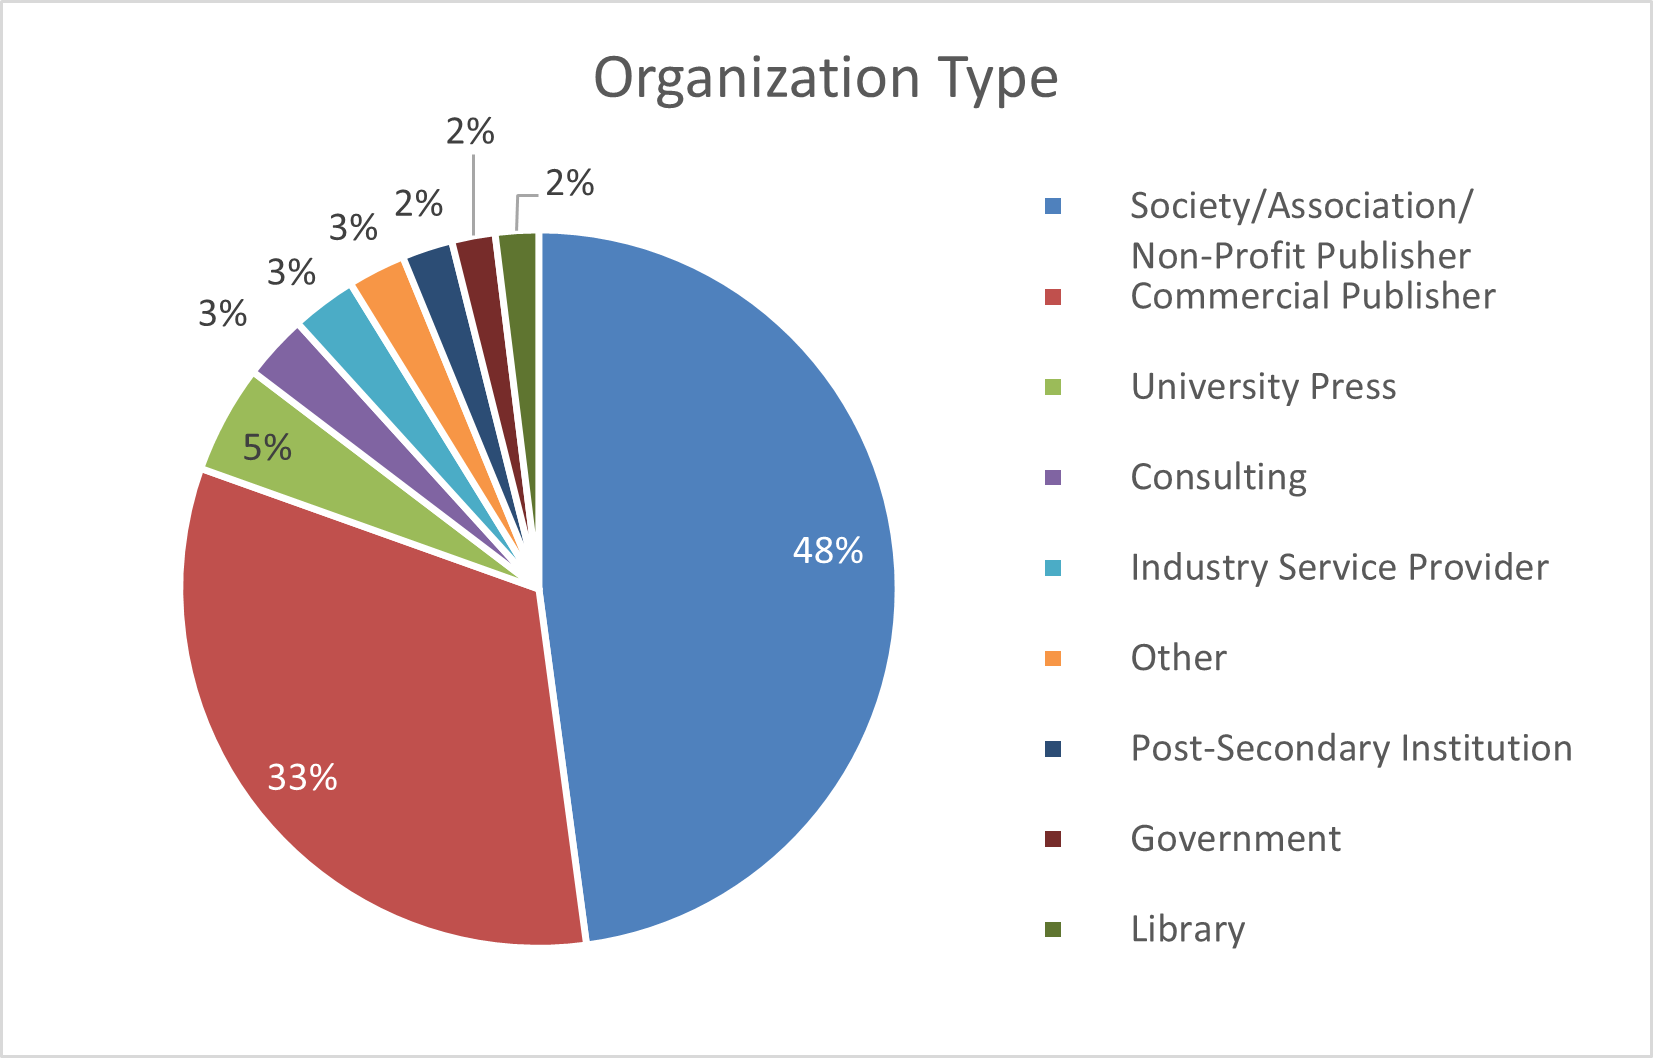
The majority (48%) of respondents indicated their current employer is a society/association/non-profit publisher, followed by commercial publishers (33%), and university presses (5%). Also represented are industry service providers and consultants at 3% each and post-secondary institutions, government and library organizations at 2% each.
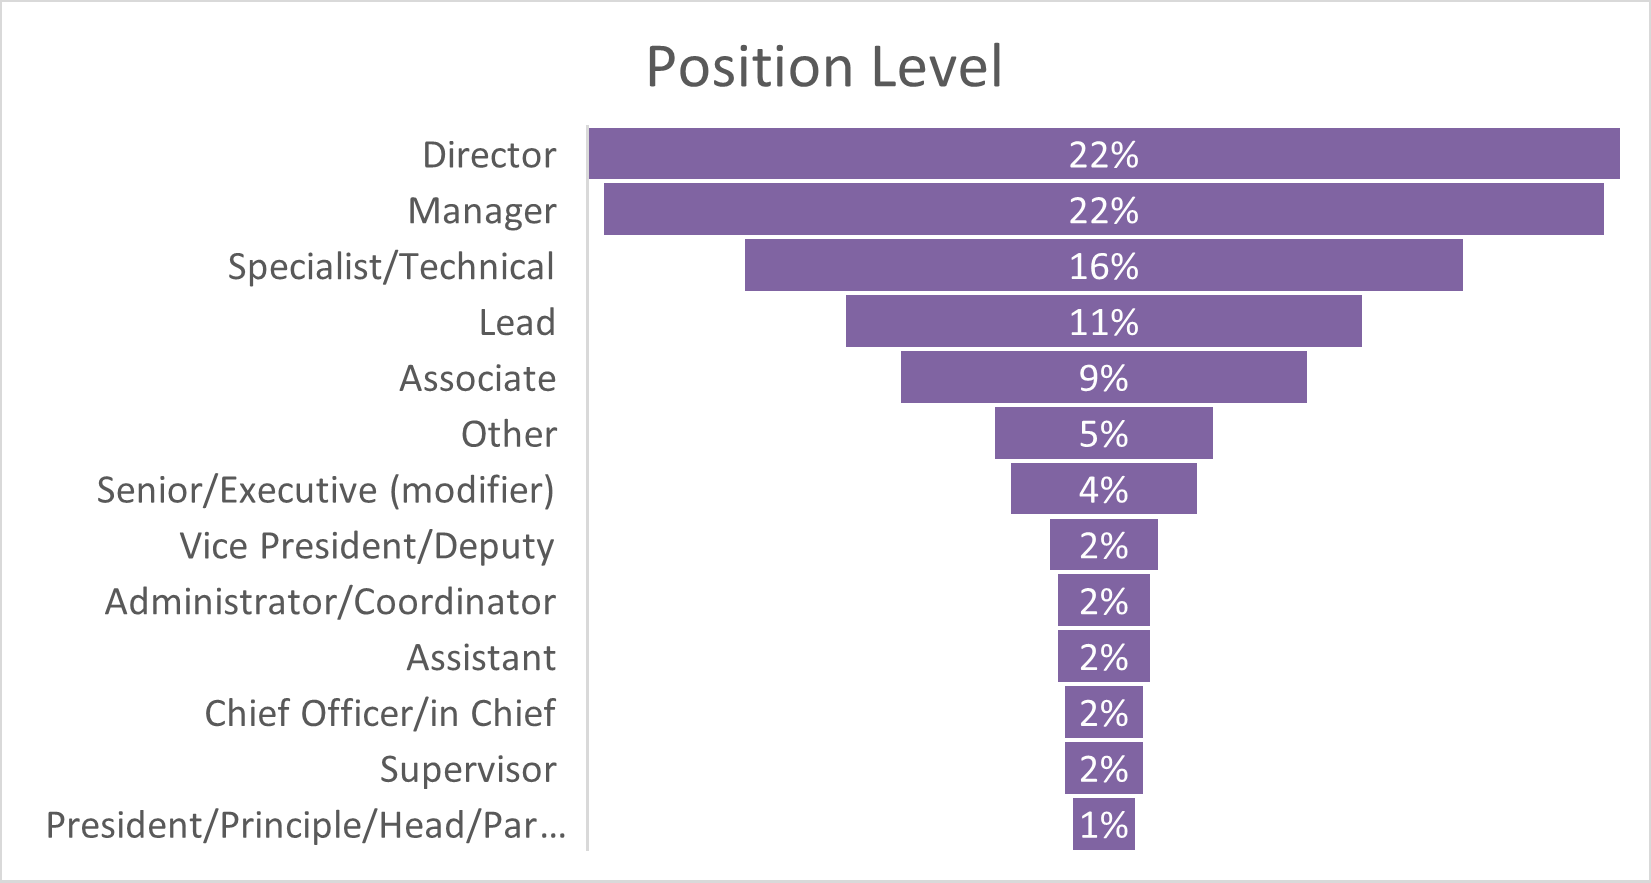
One of the biggest challenges in developing the survey was how to provide meaningful comparisons for participants when job titles can vary widely from organization to organization. We landed on a three-tier classification system of level (i.e. director, supervisor, manager), functional area ( i.e. marketing, operations, production) and focus (i.e. journals, peer review, books) to describe a position.
The majority of respondents hold positions at the managerial level (director, manager, or C-suite).
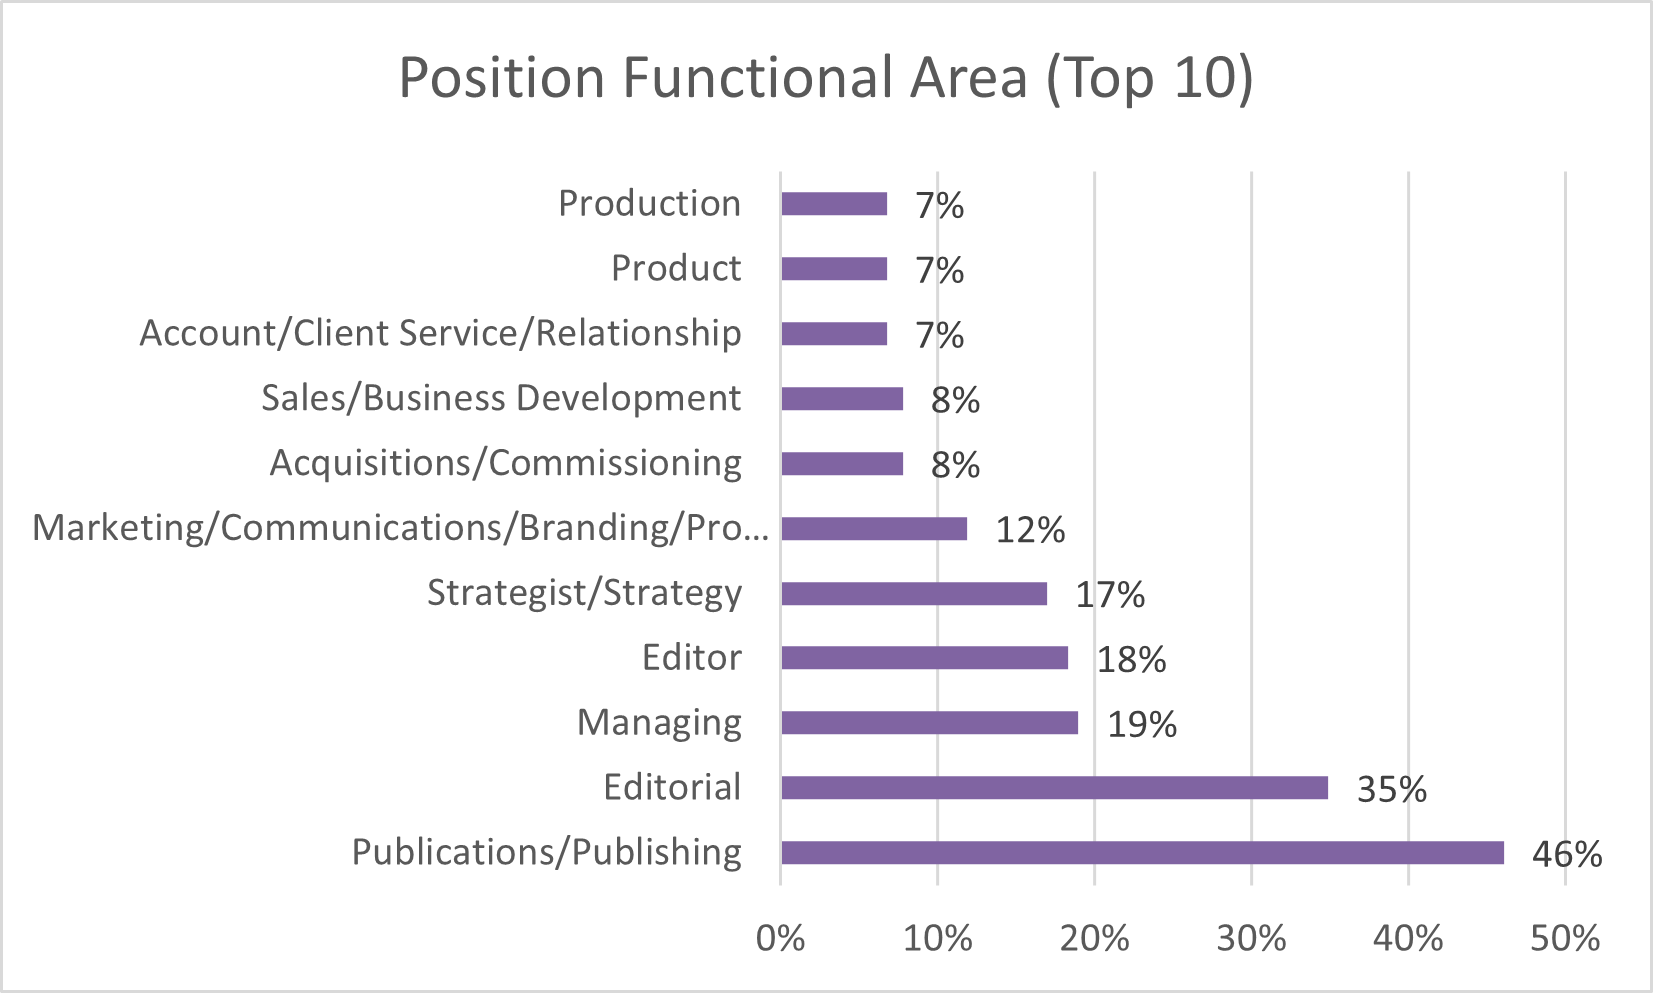
The top 10 (well, really 11 because of a tie) functional areas reported by respondents are represented in the chart below. Unsurprisingly, publishing/publications and editorial topped the list. Respondents could select up to 3 functional areas related to their job.
We also asked for actual job titles, and we plan to analyze this data before the next study iteration to determine this approach’s effectiveness and if there is indeed more continuity in job titles than we anticipated.
Worker Satisfaction
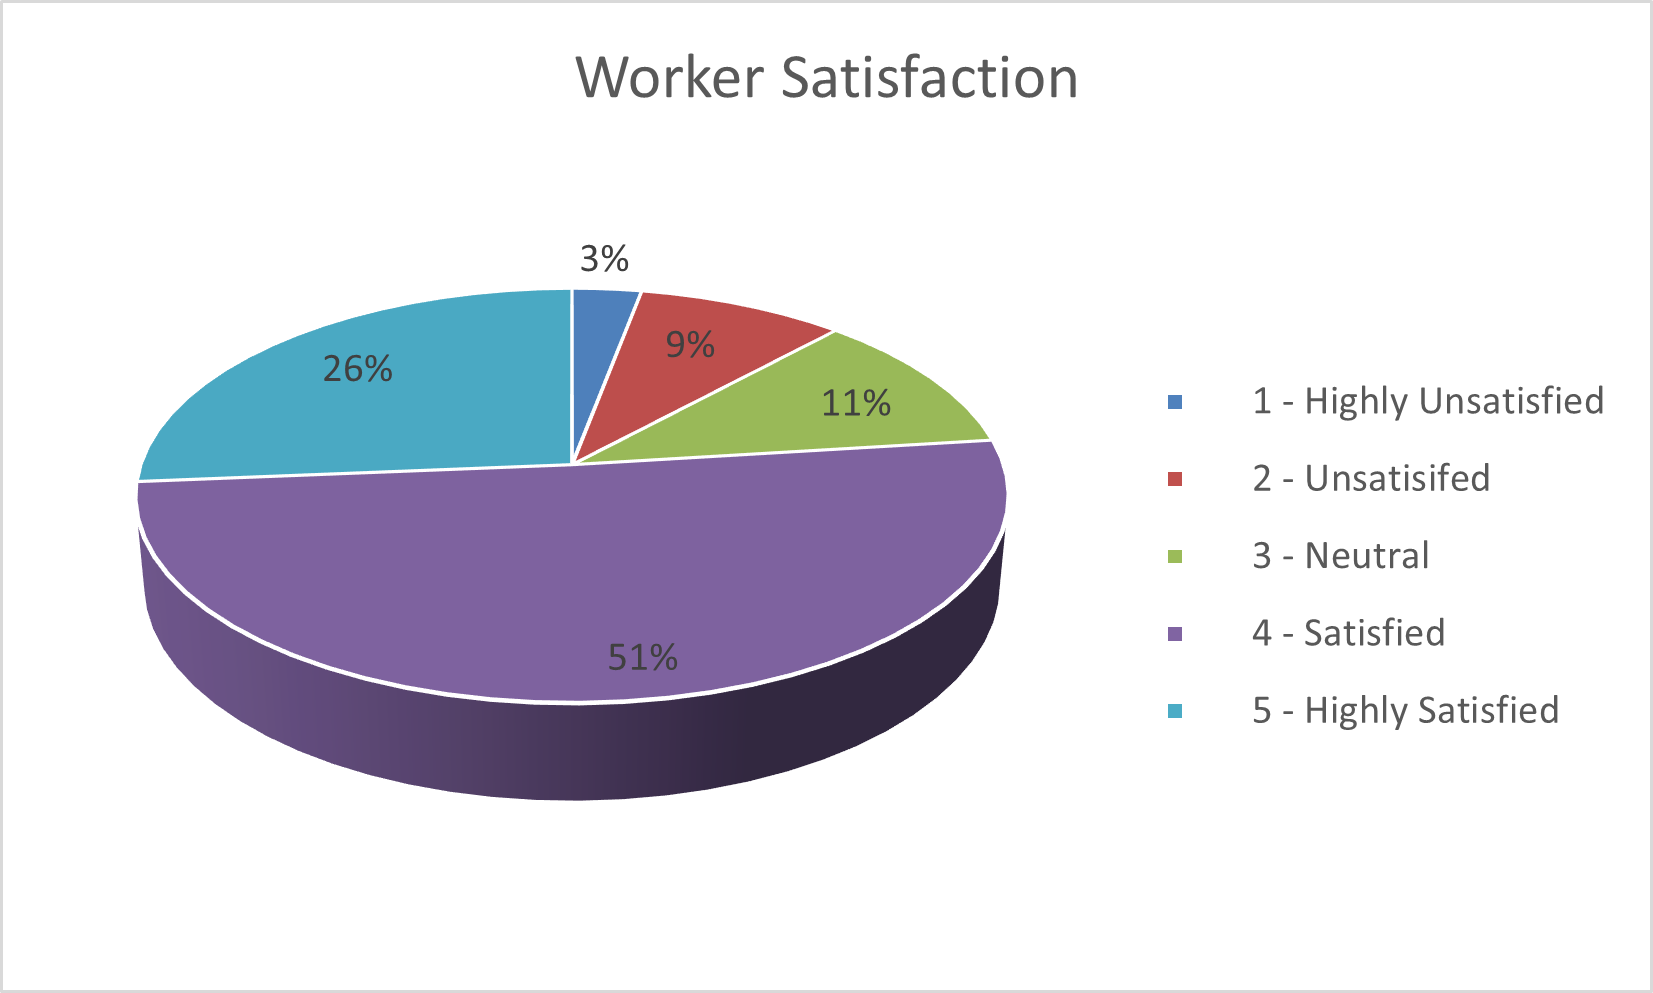
While the study is largely focused on compensation and benefits, and those are the areas that we expect to be the most anticipated for participants, I found the results of the Worker Satisfaction section particularly encouraging.
When asked about satisfaction in their current position, 75% of participants responded that they were satisfied or highly satisfied in their current role. According to a 2024 Pew Report, “half of U.S. workers say they are extremely or very satisfied with their job overall. Another 38% say they are somewhat satisfied, and 12% are not too or not at all satisfied with their job.” While the response scales aren’t exactly congruent between the two reports, It seems that the satisfaction level in scholarly communications is outpacing the overall average (at least in the US).
Further, the majority of respondents, 70% are not seeking a new position at this time. Nineteen (19%) are actively looking for their next opportunity and the other 12% are unsure if they are ready to make a move. For comparison across all industries, according to research from talent solutions and business consulting firm Robert Half (reported February 2024), 36% of workers plan to look for a new job in the next six months, down from 49% in July 2023.
The Robert Half study further reported that workers are more likely to stay if their current job offers a level of flexibility that they aren’t willing to lose, they feel fulfilled in their current role, and they feel well compensated for their work. Main motivators for switching jobs were a higher salary, better benefits and perks, and more remote flexibility than their current organization offers.
Creating an inclusive community is one of SSP’s core values and we are encouraged that this sentiment appears to extend to the organizational cultures of SSP’s members as well. Seventy-eight percent (78%) of respondents reported that they feel a sense of belonging and inclusion within their organization. There is certainly room to improve, especially if the 10% reporting that they don’t feel this sense of belonging and inclusion in their organizations, or the 12% that are unsure if they do, are members of underrepresented groups in the industry. I’ll be digging deeper into this data to see if that’s the case.
Remote Work
A couple of data points in the benefits section also caught my attention. Anecdotally, I’ve always assumed there was a good deal of flexibility when it comes to telecommuting in the scholarly communications community by the number of folks participating in SSP committee meetings from their home offices. Of course, during the pandemic, the majority of scholcomm professionals were working remotely quite successfully, but I was curious to see how this may have shifted now 5 years down the road.
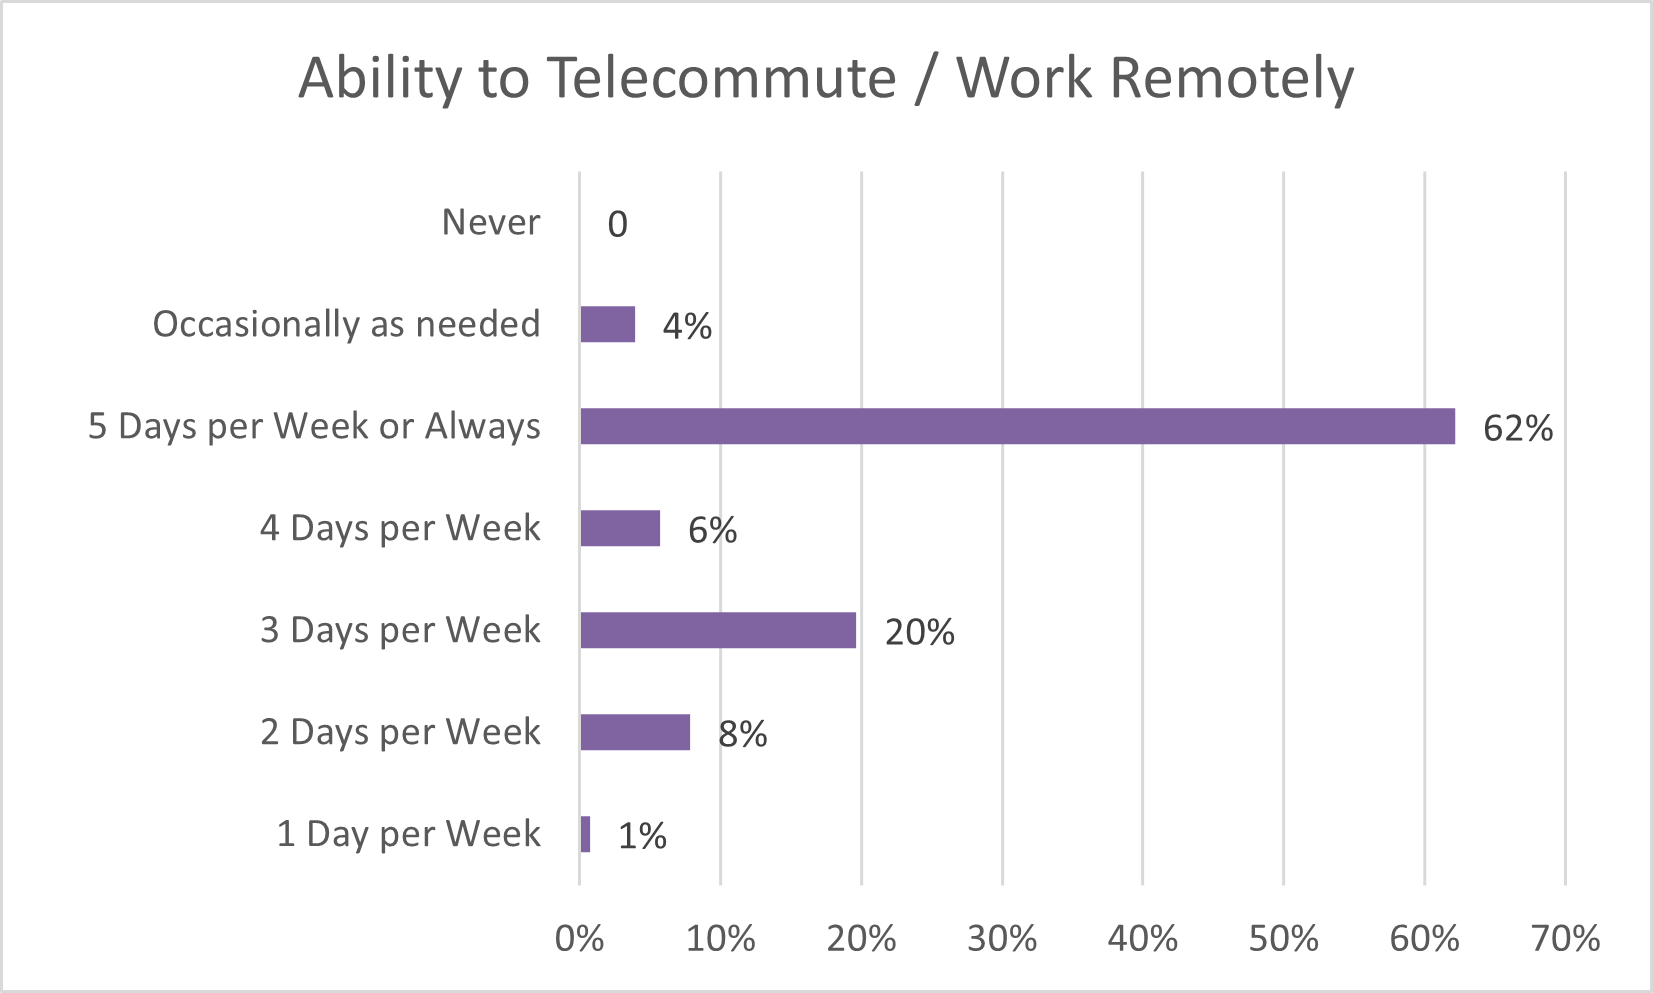
What stood out to me is that 62% of respondents have the ability to work remotely 5 days per week (or always). The most recent comparative remote work statistics I could find from the U.S. Bureau of Labor Statistics (reporting 2023 data) showed that “35% of employed people did some or all of their work at home. Workers with higher levels of education were more likely to work at home than were those who had less education. Among workers age 25 and over, 52% of employed people with a bachelor’s degree or higher performed some work at home on days they worked.”
Flexible work schedules and the ability to telecommute are frequently cited as top benefits to attract and retain workers. A 2024 Society for Human Resource Management (SHRM) employee benefits survey shows flexible working benefits as the fourth most important benefit (as reported by employers) behind only healthcare, retirement, and paid time off. This January 2025 Pew Report indicates that many remote workers (46%) say they’d be likely to leave their job if they could no longer work from home.
Continuing to offer generous telecommuting/remote work policies at a time when many industries are calling workers back to the office may prove to be a solid strategy for retaining and attracting talent in the scholarly publishing sector.
Challenges
Designing this survey was no small undertaking and we know there are ways we can improve it for future iterations. As I mentioned previously, we know the job titles piece can be tricky and we’ll work to refine this part of the survey based on this year’s data collection.
While a large percentage of the respondents are from the US, our intention is to create a study that represents the global industry. We asked participants to report compensation in the currency they are paid, but for comparison reports, all compensation is converted to and reported in US dollars. Because the exchange rates can fluctuate, this can make it more challenging for non-US participants to compare wages, but it does provide for a larger possible comparison pool.
We received feedback from our non-US participants that our benefits options were too US-centric, so that is an area we’ll look at improving for the next iteration of the study. We will also be adding questions about annual increases based on the feedback we’ve received so far.
Feedback about the survey is welcome as we want to ensure this is a useful tool for our community.
Accessing Survey Results
There is so much more data to dig into as a participant or subscriber, and optional filters let users see many of these data points filtered to their position characteristics.
The survey and results are hosted on SSP’s Insights Platform. This study is a powerful tool for individuals and organizations in the scholarly publishing industry, helping them make data-driven compensation and career development decisions. Individual participants meeting the minimum participation threshold receive access to a downloadable report comparing their responses of select data points to the aggregate responses and the ability to filter the results based on position level, area, and focus.
Individuals who want to dive deeper into the study results (whether they participated or not) can purchase a premium access subscription that includes dynamic comparison reports featuring additional filters, including level, area, focus, scope, region at the country and state levels, size of organization, type of organization, years of experience, and headquarters region at the country and state levels for an expanded set of data points.
This study and its future iterations will help shape fair and competitive compensation practices in scholarly communications, providing accurate, research-based data that individuals and organizations can use to make informed decisions. Data collection for 2025 will open in the fall of 2025.
The survey was developed collaboratively by SSP’s Benchmarking Advisory Group, staff, and our partner, Dynamic Benchmarking. Advisory Group members include Janine Chiappa McKenna, Association for Psychological Science; Minty Colquhoun, Maverick Publishing Specialists; Emily Ekle, American Psychological Association; Jack Farrell, Jack Farrell & Associates; Aimee Greene, American Society for Clinical Pharmacology & Therapeutics; Toni Gunnison, University of Wisconsin Press; Lucy Ofiesh; Crossref; Nicola Poser, American Mathematical Society; and Rashika Venkatarama, American Psychological Association. I want to express my gratitude to all involved for developing what I hope will become a reliable benchmarking tool for our community for many years to come.


