In late 2023, while putting together a large-scale report on scholarly journal market trends, I was struggling to quantify how much the market had consolidated and if there were any periods that showed more rapid consolidation than others. I wrote about those efforts here in The Scholarly Kitchen, concluding that there were two main waves of market consolidation: the first aligning with the rise of The Big Deal from roughly 2000 to 2006, and the second beginning around 2018 with the announcement of Plan S.
Nearly two years later, I’m head-down with colleagues writing for this year’s market trends update. Another look at more recent data is called for — this time incorporating all of the more recent journals in the market from the Web of Science’s Emerging Sources Citation Index (ESCI).
Bibliometric Databases
As was the case in the 2023 analysis, we start with some explanations of the data sources used. While dynamic bibliometric indexes like Dimensions and OpenAlex are incredibly useful, they are of little value for this type of historic analysis. These indexes are based around each article’s DOI (digital object identifier). The great thing about DOIs is that when an identified object moves between publishers, the DOI is updated to point to its new location. Which is what you want if you’re trying to find out where that object is now, but not so helpful if you want to find out where it was in the past.
Many of the journals in the market are owned by research societies and institutions. As scale has become an important key to market success, more and more formerly independent journals have now moved to publication via partnerships with larger publishers. When such a partnership contract expires, the journal sometimes moves to a new publishing partner. So the data for a hypothetical Journal X, which was published for its first fifty years as an independent, and then moved to publication with Wiley for ten years, and then currently to publication with Oxford University Press (OUP) should reflect that whole history. Instead DOI-based databases tell you that Journal X has always been published by OUP, because its DOI only reflects its current publisher.
DOI-based databases are often preferable because they contain so much more of the research literature than curated databases, but also problematic in that they contain many things labeled as “articles” that have DOIs but that aren’t research papers (e.g., articles from magazines like Scientific American, and Cerveau & Psycho). These magazine articles can’t easily be filtered out.
Clarivate’s Web of Science (WoS) is thus the tool of choice for historic trend analysis because it offers an unchanging snapshot of each year, so even if a journal moves to a new publisher, the historic record is intact. WoS is a selective database, so while it avoids the problem of including lots of non-journal content, it has limited coverage. Where Dimensions and OpenAlex strive to include all legitimate journals, WoS is a curated subset of those that have passed Clarivate’s criteria for inclusion. WoS has grown in recent years, as it integrated its Emerging Sources Citation Index (ESCI) with its other indexes. ESCI is described by Clarivate as including “newly launched, niche and open access journals” and includes around 9,000 titles. One interesting note about the journals included in ESCI: they appear, as a group, to be lower-volume publications than the journals in the more traditional WoS indexes. If we combine ESCI with the Science Citation Index Expanded (SCIE), Social Sciences Citation Index (SSCI), Arts & Humanities Citation Index (AHCI), ESCI makes up around 40% of the total number of journals in the whole group, but published only around 17% of the total articles.
ESCI was not launched until 2015, and flagship subscribers to the WoS Core Collection can only access ESCI data for a five-year rolling period, currently 2020 to the present (I’m told by Clarivate that full ESCI subscribers have access to data going back to 2005). We want to compare apples to apples in looking at historical trends, so we either have to remove ESCI from all results (to avoid an enormous jump in the size of the literature in 2020 when ESCI journals were added), we have to look only at years that include ESCI (2020 and after). So, this analysis is now addressing two questions: 1) what does consolidation look like over the long term in the main indexes of the WoS — SCIE, SSCI, AHCI, along with a smattering of articles from the Conference Proceedings Citation Index – Science (CPCI-S) and the Conference Proceedings Citation Index – Social Science & Humanities (CPCI-SSH)? 2) What do things look like from 2020 to 2024 with all of the above and ESCI included?
While conference proceedings papers are included, conference abstracts were excluded from all searches below, as were book chapters. Springer and Nature are treated separately until their merger in 2015, as are Wiley and Hindawi until their merger in 2021. As before, each chart below looks at the percentage of the WoS corpus published by the 5 biggest publishers by volume in the market in a given year, the 10 biggest publishers, and the 20 biggest publishers. It is worth noting that the identities of the largest publishers in the market varies from year-to-year.
The Long Term
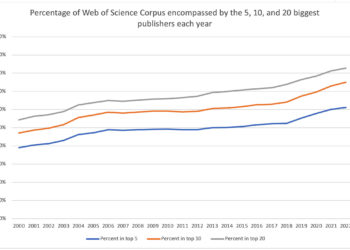
First, let’s examine data across the WoS indexes excluding ESCI, following on from the previous analysis.
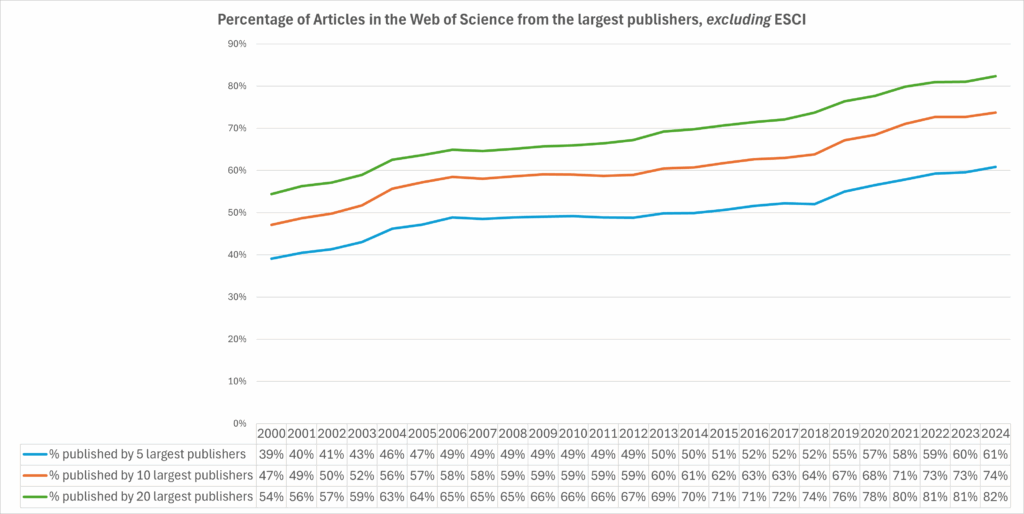
There are two clear inflection points where the market showed increased consolidation. From 2000 to 2006, the 5 largest publishers saw their share of the overall market increase by 10% (from 39% to 49%), coinciding with the rise of The Big Deal. The share of the 10 largest publishers in the market grew by 11% (47% to 58%), and the 20 largest publishers’ share also grew by 11% (54% to 65%). After that, things stabilized for roughly the next decade, with consolidation increasing much more slowly, growing by only 3% for the top 5 publishers between 2007 to 2017 (5% for the 10 biggest publishers and 7% for the 20 biggest publishers). Then in 2018 (coinciding with the release of Plan S), consolidation once again became more rapid. Between 2018 and 2024, the 5 largest publishers saw their market share grow by 9%, from 52% to 61% of the total market. The 10 largest and 20 largest publishers saw similar gains, growing 10% and 8% in six years.
Since my 2023 analysis ending with 2022 data and using the original WoS scope, consolidation appears to have continued to rise, but more so for the 5 largest publishers in the market (2%) than the top 10 or top 20 (1%). An open question during the last two years was whether the declining publication volumes seen by MDPI (one of the 5 largest publishers) and Frontiers (one of the 10 largest publishers) change this trend in market consolidation, as both experienced declining article volumes in 2023 and 2024. These declines do not seem to have had any significant impact on consolidation. The articles leaving MDPI and Frontiers may largely be moving to the journals of the other large publishers in the market (Heliyon and Scientific Reports among others), leaving the market altogether, or scattering widely enough to not impact consolidation figures.
Now with ESCI
So, what happens when we add ESCI into the mix, bringing in 9,000 relatively new journals?
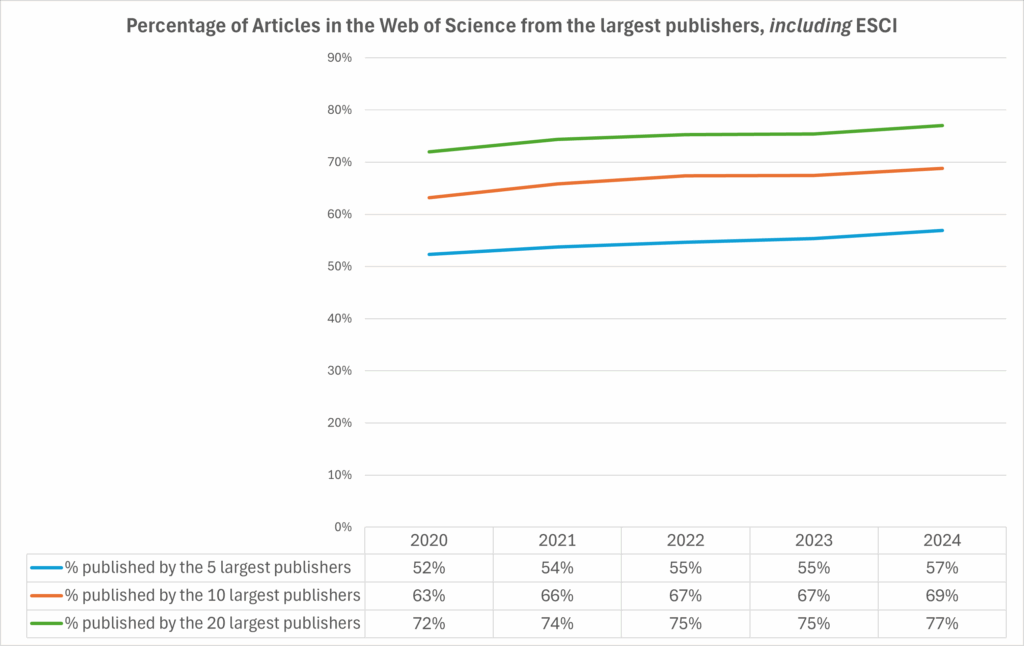
The first thing we notice is that using this expanded dataset makes the market look less consolidated. The 5 largest publishers are responsible for only 57% of total articles (4% less than seen without ESCI, and the equivalent to where things stood in 2020). The 10 largest and 20 largest publishers see similarly smaller market shares as well (69% and 77%, both 5% less). Clearly, ESCI is bringing in a more diverse set of journals from a wider range of publishers, although as noted above, because these journals are smaller in terms of article output than those in the other indexes, they have less impact on market sizing than we might expect from the number of journals added.
Consolidation, however, is still continuing, even with these newer journals in the mix, growing 5%–6% for each group of publishers over the last 5 years.
What’s Next?
Factors that tend to drive increases in publication volume for journals — namely, Journal Impact Factors (JIFs) and funder policies — will likely come into play for future analyses for a few reasons. First, Clarivate has changed the way JIFs are awarded. In the past, journals in ESCI did not receive JIFs and were not ranked in categories in the Journal Citation Reports. This changed in the 2023 and 2024 releases, and now all journals included in ESCI get JIFs and are ranked in category. This makes them more competitive for attracting authors, and with a broader pool of journal owners included in ESCI, we may see a slowing of consolidation as newer venues experience growth.
That said, we are also on the verge of significant changes in funder policy.. As of 2026 (July 2025 for the National Institutes of Health), US federal funding agencies will require publications to be made publicly accessible immediately upon their release. These policies, along with potential caps on open access article processing charges, are likely to drive authors to publish in journals that are included in institutional transformational agreements, where the costs of publication are not drawn directly from research budgets. Because these agreements are complex and more common to the larger publishers — who have both the staff to negotiate significant numbers of them and the publication volume to bring libraries to the negotiating table — it is expected that US federal policies will drive further market consolidation, favoring the largest publishers in the market. How these two market forces interact remains to be seen, although results of the US government’s radical shifts in policy (both toward public access and research funding) will probably not be clear for several years as both publishers and authors adjust to their new realities.
(Update: new information on access to ESCI data from Clarivate added on August 26).

Discussion
1 Thought on "2025 Update: Quantifying Consolidation in the Scholarly Journals Market"
A really insightful continuation of your 2023 analysis, thank you for sharing the updated trends with ESCI included, especially the contrast between ESCI’s diversification and the continued rise in consolidation. It highlights how bibliometric infrastructures don’t just record the market but shape it, and with funder mandates and transformative agreements ahead, the real test will be whether this new diversity can withstand the gravitational pull of the largest publishers.