Scientists are trained to never to accept anything at face value. Even the most obvious of statements requires supporting data, otherwise it must be treated with skepticism.That training has been on my mind over the last few months as I’ve worked with colleagues to put together a large scale report on trends in the journals publishing market. A key trend, obvious to any publishing consultant or acquisitions editor buried in a seemingly endless (and seemingly rising) stream of independent journals seeking a partnership with a larger publisher, is the ongoing and ever-increasing market consolidation that has been accelerated by the move to open access (OA). We all know this to be true, but where is the data?
Looking at the literature, the references I can find are out of date, the most recent being Lariviére et al., from 2015, looking at conditions in 2013. With nothing available for the last decade, I set out to see if the obvious was indeed true.
Caveats: Issues with DOIs, publisher metadata, and bibliometrics databases
A trip to a local university’s library offered access to all the major bibliometric databases. While I have frequently used these databases to look at the current (or at least recent) state of individual journals and journal portfolios, this was one of the first large scale historical analyses I’ve done, and I learned many lessons along the way. What at first seemed a fairly straightforward research project very quickly got a lot more complicated, due to the, er, persistent nature of persistent identifiers (PIDs). Many of the bibliometric databases we use to analyze the literature are based around DOIs (digital object identifiers) for articles. DOIs are awesome, because they aim to resolve to their targets even if the location of that target moves somewhere new. That’s what makes them persistent, and it offers tremendous benefits when you want to find something today. But it raises problems for trying to figure out where it was yesterday.
As an example, the journal GENETICS was independently published by the Genetics Society of America (GSA), beginning in 1916. In 2021, the GSA signed a publishing services agreement with Oxford University Press (OUP). All of the journal’s back issues moved over to the OUP platform, and all of the DOIs associated with those articles now resolve to OUP. Which means that bibliometric databases that find articles based on DOIs will now tell you that OUP has always been the publisher of GENETICS, all the way back to its founding, because that’s where the DOIs point.
And that makes historical trend analysis difficult. And so I turned the Web of Science (WoS). WoS has the advantage of creating an annual snapshot of the literature that isn’t dynamically updated. Publisher information is still kind of spotty in WoS – unlike other databases, WoS still sees GENETICS as independently published by GSA (all 2022 articles are credited to the society as the publisher, despite having moved to the OUP platform). And like other bibliometric databases, WoS has failed to recognize some of the major mergers that have taken place over the last two decades. Nature journals are still listed separately and not included under “Springer Nature” despite the two merging in 2015. Hindawi remains a separate entity from its 2021 owner, Wiley. For my analysis, these mergers had to be adjusted for manually and the companies treated as one after their respective mergers. Next year’s study will likely need to manually merge De Gruyter and Brill. I don’t know if these issues are due to poor metadata supplied by publishers or are based on how each individual database chooses to capture its sources. I’ve not vetted the WoS data on a journal-by-journal basis, so the results presented below may need to be taken with a grain of salt and show large scale trends rather than accuracy on a detailed level.
One useful benefit of WoS is that it allows the user to readily filter out Meeting Abstract articles. Many journals publish the abstracts from their host society’s annual meeting, which can inflate the article totals for a journal by thousands, even if these aren’t full articles that were vetted through peer review by the journal’s editorial board. This sort of filtering much is more difficult, if it’s even possible, in some of the other major bibliometric databases.
The downside to WoS is that it is a selective database — that is, it only indexes a subset of the literature, those journals that have passed Clarivate’s criteria and been deemed worthy of inclusion. Though not a comprehensive measure of the field at large, it does at least give us a sense of what’s going on with a large portion of the journals seen as important by the research community (i.e., those with Impact Factors). So I’m using it here as a proxy for the entire market, although my conclusions should be taken with the caveat that the limited sample size ignores things like non-English language journals, regional journals, or anything beneath Clarivate’s level of inclusion.
Quantifying the Market
To get a sense of market consolidation, I first quantified the number of articles in the WoS per year (excluding Meeting Abstracts). This can be seen in Figure 1 below. In 2018, the WoS added a huge number of journals to its database via the Emerging Sources Citation Index (ESCI), but as these journals weren’t counted in earlier years, I excluded them as well to keep things consistent.
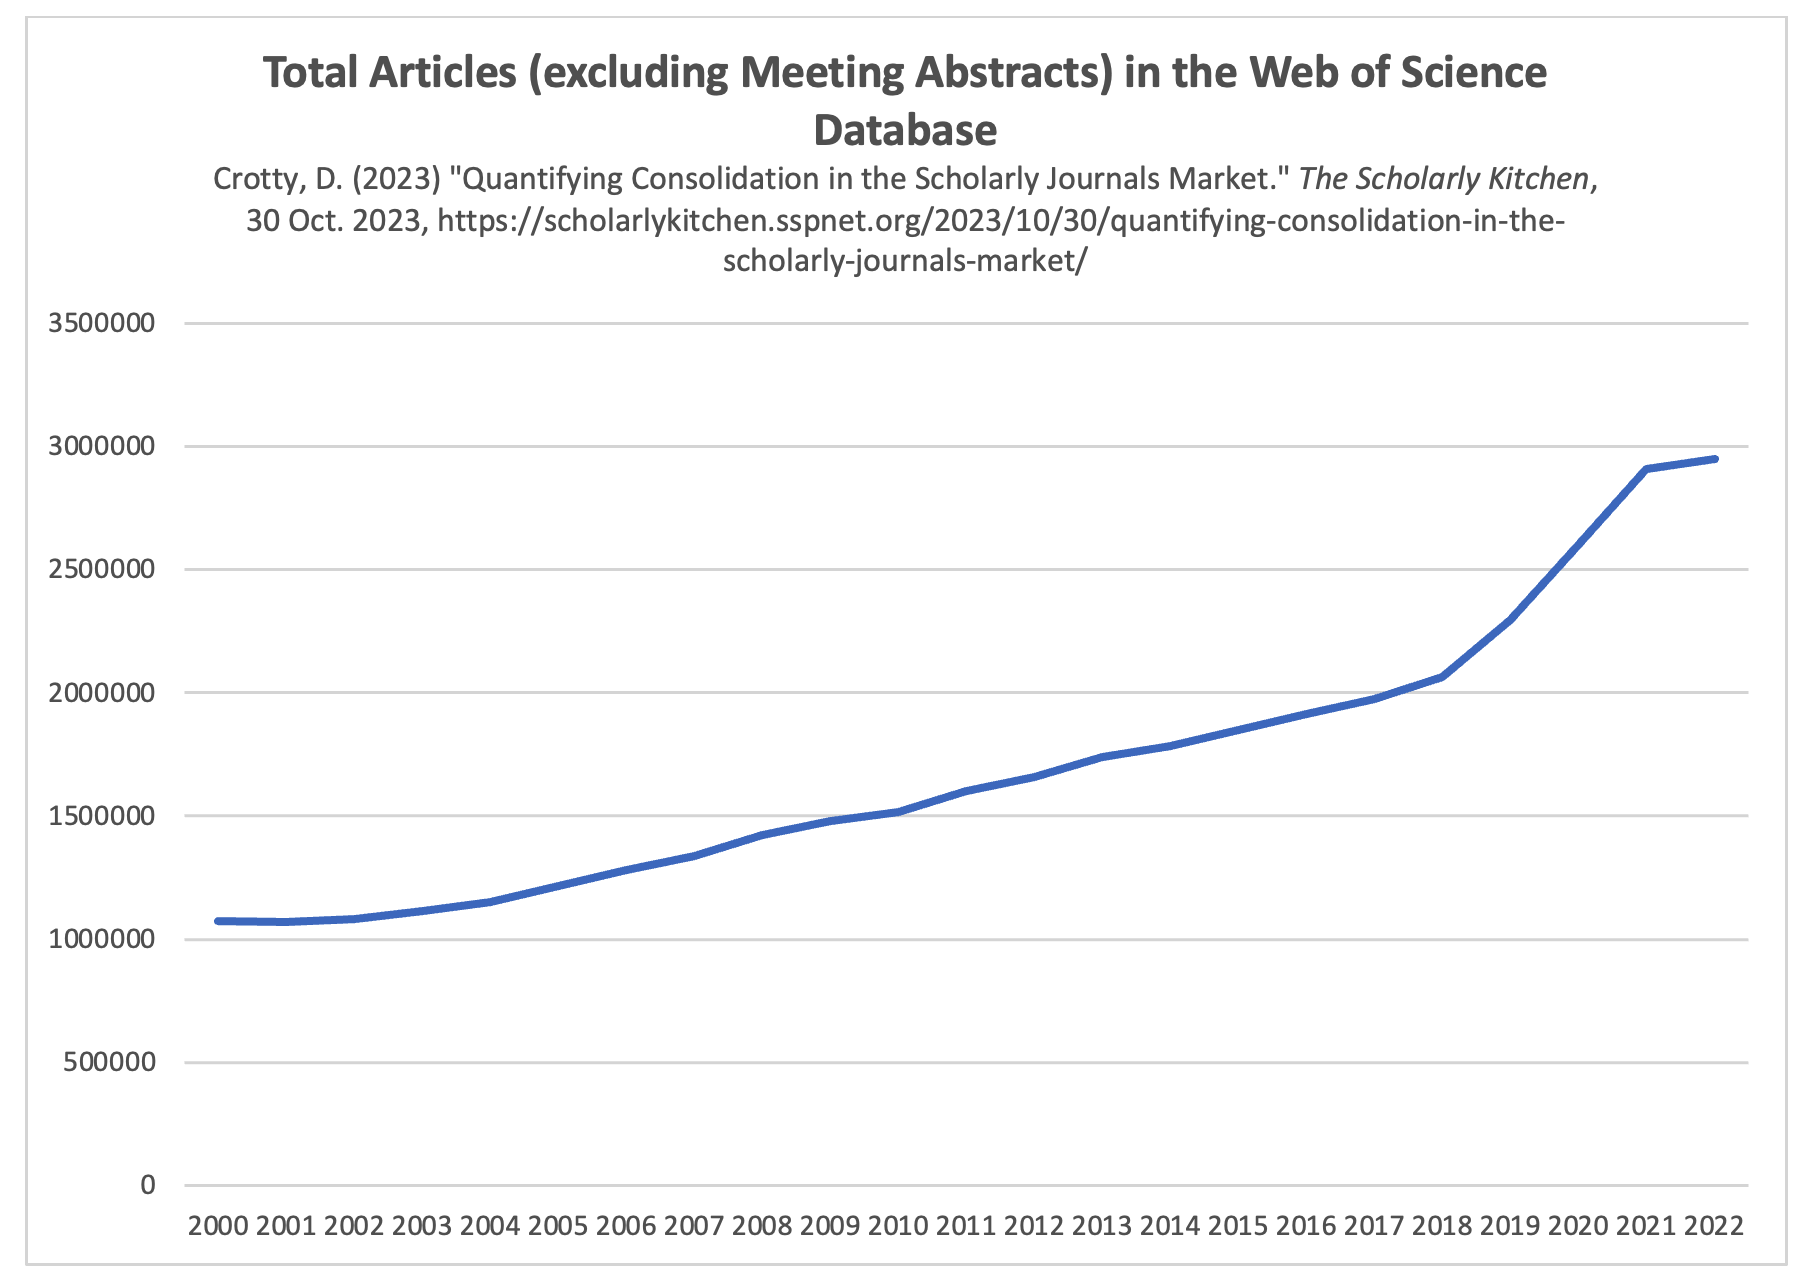
2018 appears to be something of an inflection point. After three straight years of the corpus increasing by around 60,000 articles per year, 2018 saw an increase of more than 90,000 articles, followed by an additional 228,000 in 2019. This was followed by the pandemic years (2020 and 2021) which each saw more than 300,000 additional articles than the previous year. In 2022, the pandemic spike dropped off with only a 42,000-article increase over the previous year. I’ve not uncovered a clear reason for the non-pandemic aspects of this jump, although it has not escaped my attention that 2018 is the year Plan S was launched. It also coincides with significant publication volume growth from MDPI and a big jump in the publication of special issues by MDPI and Frontiers.
Quantifying Consolidation
With a set of measurements for the size of the WoS corpus between 2000 and 2022, I then sought to measure consolidation through determining how much of that corpus could be found in the 5 largest (by article volume), the 10 largest, and the 20 largest publishers each year.
The percentages of the WoS corpus encompassed by the 5, 10, and 20 biggest publishers each year can be seen below in Figure 2.
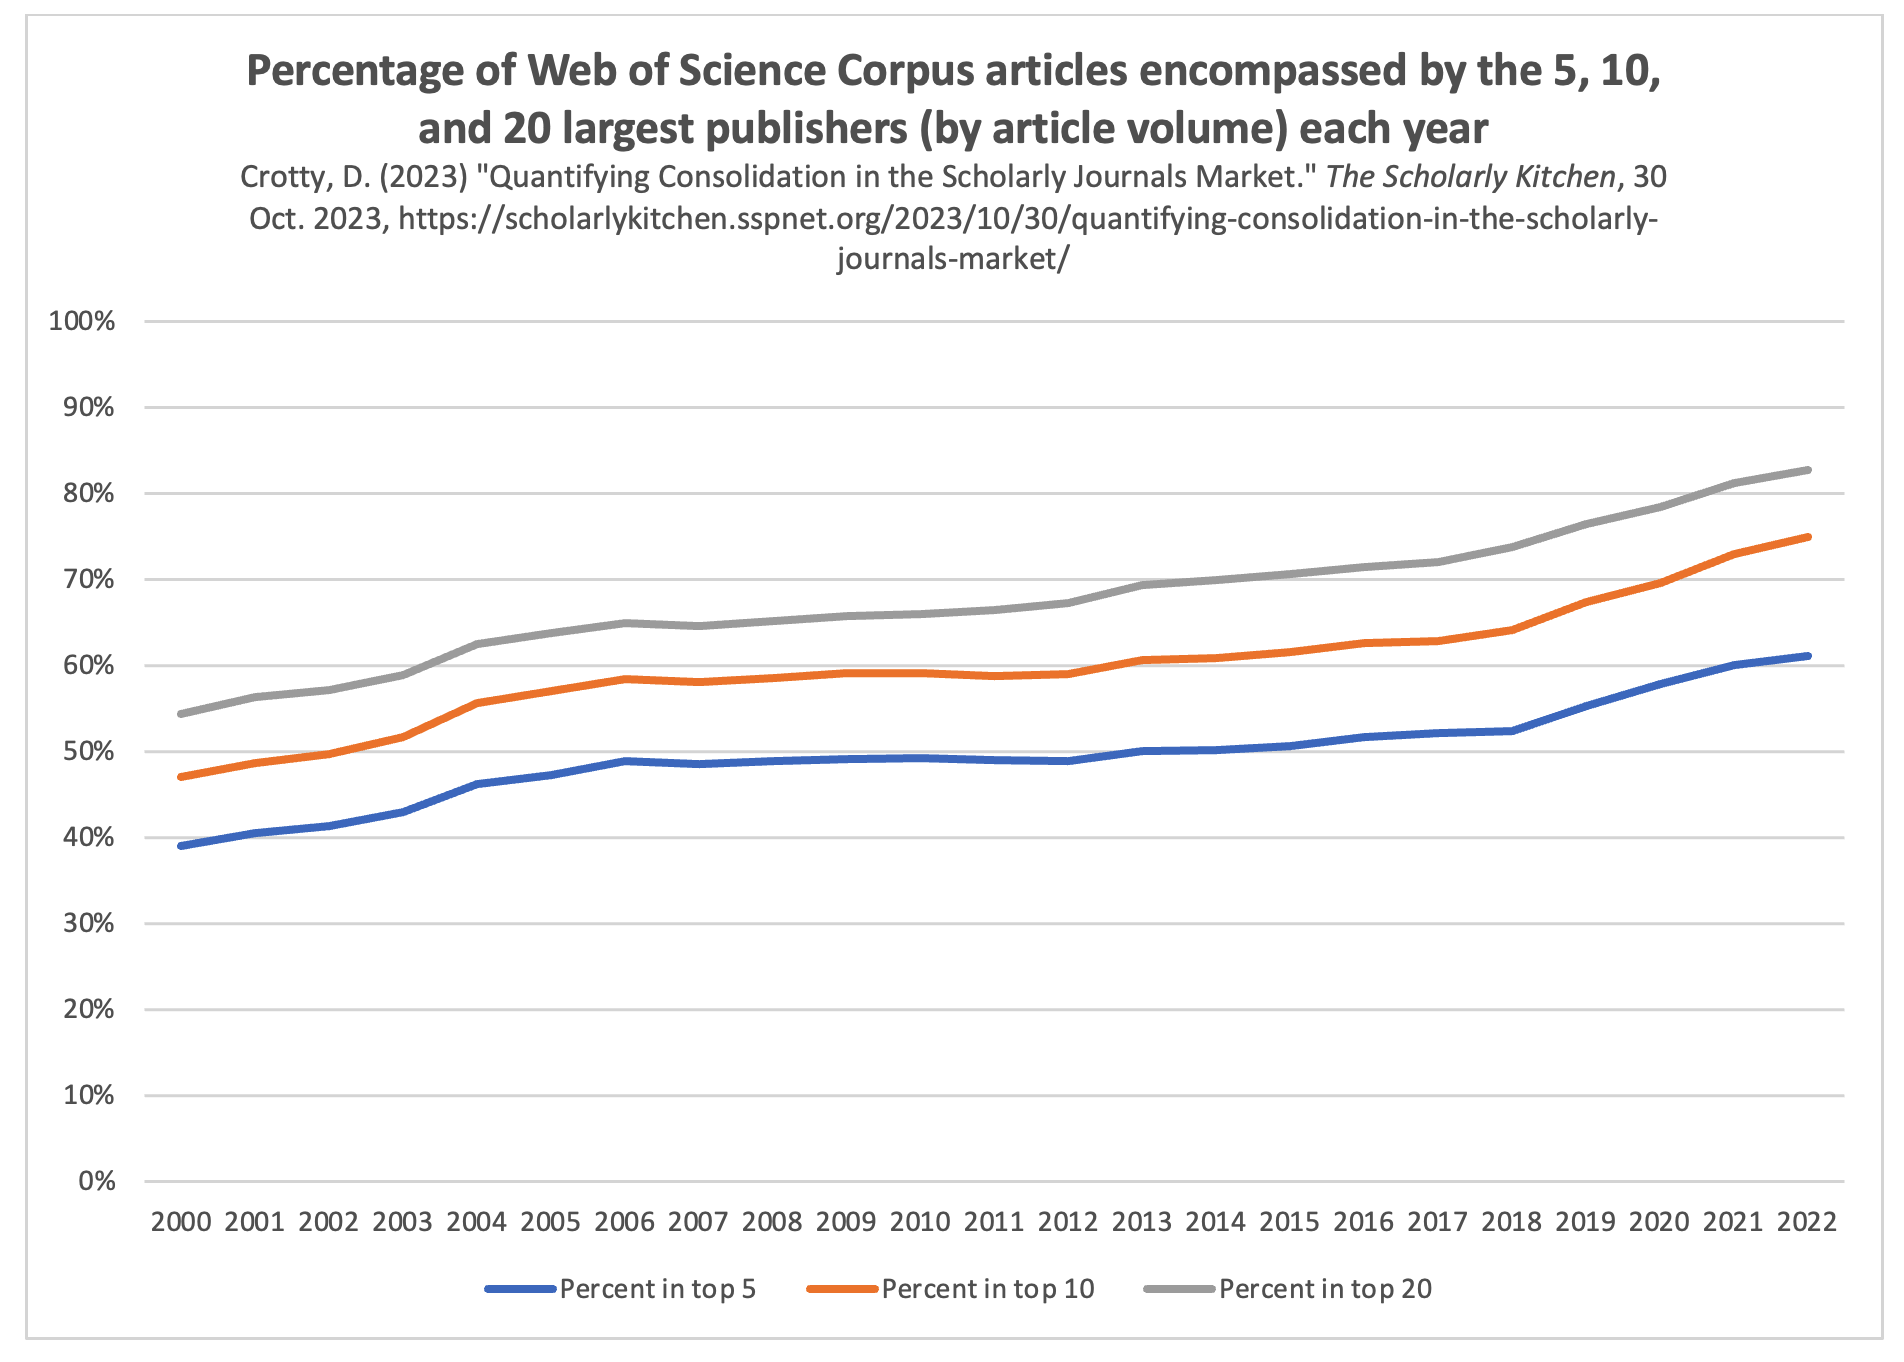
Overall, the market has significantly consolidated since 2000 — when the top 5 publishers held 39% of the market of articles to 2022 where they control 61% of it. Looking at larger sets of publishers makes the consolidation even more extreme, as the top 10 largest publishers went from 47% of the market in 2000 to 75% in 2023, and the top 20 largest publishers from 54% to controlling 83% of the corpus.
These data show two main waves of market consolidation. The first wave aligns with the rise of The Big Deal journal subscription package model, roughly 2000 to 2006. During this period, it became increasingly difficult to remain independent, as large journal packages began to swallow up more and more of each library’s budget. Getting into a Big Deal package provided financial stability as independent journals became much easier for libraries to cancel than large packages of hundreds or thousands of journals. Over this period, the top 5 largest publisher increased their share of the market from 39% to 49%, the top 10 largest increased from 47% to 58%, and the top 20 from 54% to 65%.
After that, there was a period of relative stability. From 2006 through 2018, there was only minor movement toward consolidation. The largest 5 publishers’ share remained fairly stable, moving from 49% in 2006 to 52% in 2018. On a larger scale though, the largest 10 publishers grew from 58% to 64% and the largest 20 from 65% to 74% — significant growth but still less than the previous (and shorter) 6 year period. This period of stability encompasses both the 2013 US Office of Science and Technology Policy (OSTP) Holdren Memo public access policy and the 2013 RCUK (now UKRI) OA policy. The 12-month embargo of the Holdren Memo and the relatively small percentage of the literature that fell under RCUK seem to have reduced their impact on market consolidation, which climbed 2% (top 5), 3% (top 10), and 5% (top 20) in the five years after their implementation.
The next wave of market consolidation began in 2018 and continues through the present day, presumably driven by the rise of OA due to new funder regulations. In a mere four years (2018 to 2022), the percentage of the market controlled by the 5 largest publishers has leaped from 52% to 61%, the 10 largest from 64% to 75%, and 20 largest from 74% to 83%. As 2018 turned into 2019, when I declared that we had entered “The Great Acceleration,” I was clearly on to something.
Unintended Consequences
The dominant business models for OA are volume based and reward scale, driving the biggest companies to get bigger, and smaller organizations to seek the shelter of a larger partner. Publication volume is the essential measurement of success in an author-pays OA market. Transformative agreements (aka, the “Bigger Big Deal”) have become the preferred purchasing model for journals, again favoring scale, because the resource-intensiveness required to negotiate and administer such deals leads to the benefits accruing to large publishers with large numbers of journals for researchers and scholars to publish in.
Though it was clearly not the intention of cOAlition S to consolidate market power in the hands of a small number of large commercial organizations, this is an unfortunate result of forcing the market into a rapid state of change rather than allowing a more measured evolution. As the biggest publishers continue their rapid pace of merging, acquiring new partners, launching new journals, and growing their existing journals, it’s unlikely this trend will slow any time soon.
Please Check My Work!
I would greatly appreciate any insights that bibliometricians and other analysts can add. The spreadsheet behind these charts can be downloaded here. Is there a better way to measure/track market consolidation? Do you see other trends or other reasons for the various shifts? Let me know below in the Comments, thanks!

Discussion
26 Thoughts on "Quantifying Consolidation in the Scholarly Journals Market"
I opened your spreadsheet in hopes of finding out what you characterizes as the top 5 etc publishers, only to find only the summary data, not the per-publisher data. So there wasn’t much I could do to “check your work”, aside from notice that your percent formulae seemed correct, but that’s trivial.
I’m not sure your conclusion about the causal relationship between cOAlition S and these numbers is justified. Even if the change is due to OA, the OA movement is a lot bigger than that one coalition. And the very fact that one giant change seems to have happened in exactly the same year is a red flag to me, as it seems unlikely the publishers moved that fast so it’s likely those changes were already in the works. As to MDPI and Frontiers being significant, that’s part of why I wanted to see the actual list of publishers in your data groups.
You may also want to know about the Transfer database, which might have helped track journal transfers, just fyi for the next such study: https://journaltransfer.issn.org/search
Hi Melissa, I don’t have that data in the spreadsheet because it’s not the question I was looking to answer. By “check my work” what I’m really interested in is if the logic follows or if there’s a better way to quantify these changes in the market.
To briefly answer your question though (at least for the top 5 publishers), it’s largely stable, beginning in 2000 with:
Elsevier
Wiley
Springer
LWW
T&F
In 2003, T&F moved ahead of LWW
In 2005 ACS replaced LWW at the 5 spot
In 2009 Springer moved ahead of Wiley to the 2 spot
In 2015 OUP moved into the 5 spot replacing ACS
In 2016 Sage replaced OUP in the 5 spot
In 2017 ACS replaced Sage reclaiming the 5 spot
In 2018 MDPI replaced ACS in the 5 spot
In 2021 MDPI moved up to the 4 spot
In 2022 MDPI moved up to the 3 spot
Specifically for MDPI, they hit the top 20 in 2015, climbed 5 spots in 2016 to number 15, jumped to the 5 spot (from 13) in 2018, and moved up as noted above.
For Frontiers, they hit the top 20 in 2014, top 15 in 2017, jumped to 7 (from 12) in 2021, and now sit at number 6.
I agree with you that the rise of OA is multi-faceted and can’t be credited/blamed solely to cOAlition S. There are far too many confounders to make that determination (e.g., the rise of megajournals, special issue strategies). But from an anecdotal viewpoint, as someone doing acquisitions at the time for a publisher, and someone now doing RFPs on behalf of research societies, Plan S was a remarkable accelerant, and the quantity we dealt with who stated that Plan S was why they were abandoning independent publishing spiked up rapidly. We’re seeing a similar spike now with the Nelson Memo, which I suspect will show even more consolidation in future years.
Thank you for the tip on the transfer database. The summary statistics are really interesting:
https://journaltransfer.issn.org/statistics
http://science.sciencemag.org/content/363/6425/332/tab-e-letters
RE: Scientific societies worry about threat from Plan S
Authors
Malcolm L. McCallum
Publication date
2019/3/14
Journal
Science
Thanks David. Interesting analysis. The question you ask at the outset is whether there is data on independent journals joining bigger publishers. The question you answer is whether big publishers have increased market share. Those are two discrete questions. As you say, much recent growth in the ‘big’ publishers will be driven by OA publishers like MDPI and Frontiers. Will you write again on the question you ask at the beginning – whether independent journals are moving? I am not clear what recent trends are myself (my feeling is that the past 2-3 years are different to what went before)
Hi Rod, to me it’s a difference without a distinction — market share is market share. If a journal is owned by Springer Nature or is partnered with and published by Springer Nature, that’s still Springer Nature market share.
But I do think there’s an interesting question to be asked about acquisitions and whether the pace has changed. The quality of the data in all the big bibliometrics databases makes this really difficult to pull out. One thought might be to use something like the Wayback Machine to track the lists of journals each publisher has on their website over time, although for someone of my limited to non-existent coding ability, that would be extremely time consuming. But in a comment above, Melissa Belvadi has pointed to the Transfer database which might be a way to get at the question:
https://journaltransfer.issn.org/search
I think there IS a distinction, and it has to do with absolute numbers versus percentages (market share). It could well be that independents aren’t moving much at all, and their number of journals is staying stable (not surprising that non-profit societies can’t handle more journals than they already do). But with the Big Guys constantly increasing their number of titles, including splits, new Gold OA, as well as purchasing from other non-independent publishers, the Big Guys market share as a percent of the total number published will increase, with no actual damage to the little guys.
Even with no acquisitions, there’s still potential damage. For example, all the articles that used to be submitted to Nature and got rejected would then get submitted to a top subject-specific journal, often one owned by a society. But now there’s a whole family of Nature journals from the top down through the Nature subject journals, then Nature Communications, the Nature partner journals, then Scientific Reports, so far less escapes the gravity of the portfolio. That might be more evident from tracking the size of independent journals over time.
True, but that’s been true since long before OA. As a librarian, I’ve been watching print journals split and split over many decades (cataloging librarians have to pay attention to coding the “preceding” and “succeeding” names/ISSNs in the MARC 780/785 for instance). Most of those Nature “family of journals” are not OA, in fact.
And yet 73% of what they published in 2022 was OA. Makes for an awful nice feeder system (and that’s not even counting Scientific Reports!).
For me, there is a difference between the two questions, and Melissa does spell aspects of the difference out. Going on anecdotal conversations (which may of course not be representative), my impression is that the consolidation of independent journals into the portfolios of big publishers has greatly slowed and possibly stopped in the past 2-3 years. Many big publishers have been looking at society publishing contracts with critical eyes and a portion haven’t been renewed. That would be a reversal of the consolidation trend that had occurred for the preceding 25 years. It would be a significant change, as the independent journals do represent the academy more closely than purely commercial publishers do.
The very big publishers are undoubtedly growing in the way you describe, David, and their market share is becoming very large. It is possible that acquiring independent journals has ceased to be a factor in this growth. The engine is now – as stated elsewhere in the comments by you and others – driven by very large journals (which are mostly OA) growing rapidly bigger.
I do appreciate the difficulties of separating out the historic data on who published which journal at which point in time. I have never seen a simple way to resolve it.
As a final thought, if one extrapolates forward from SciForum data – with all the caveats that brings – it appears that Elsevier is on track to become the largest publisher of OA articles in 2024, overtaking MDPI. That is a specific facet of the ‘market share’ consolidation you discuss. It would be a major stage in the evolution of the OA journal market and not what many would have predicted even a few years ago.
Your experience is very different from mine. From the announcement of Plan S, when I was at OUP, we were swamped with RFPs from societies looking for a partner publisher. Now as a publishing consultant, the flow has only increased since the Nelson Memo came out. The acquisition activity of the big publishers is always kind of cyclical though, and depends on their current strategies. One big company will bid aggressively for years, then stop going after societies, but then another will jump in and start going after those societies. There are also the publishers in the 5-10 range who realize that scale is essential for their survival, and are in massive growth mode looking to bring in as many societies as possible. The Brill-De Gruyter merger last week is an example of how the need for scale is consolidating the market (the new De Gruyter Brill combo now moves into the top 20 at number 18, at least by 2022 numbers). I can tell you that we’re receiving really strong bids from a lot of publishers for RFPs (not to mention really really strong bids for journal purchases when those are available), and that both Frontiers and MDPI have entered the market seeking to add society partners as well.
And that combines with the mega journals and special issues. As far as Elsevier potentially surpassing MDPI in OA content, I don’t think anyone should be surprised by their ability to adapt to market conditions and thrive. That’s what they do.
Hello David. I agree with many of the points you make. The fact that our perceptions differ – mine based on many conversations with society publishers, and also with some of the big publishers – suggests that there is still a question about independent journals to be answered here.
Was thinking also that with the corpus growing from 1M articles to 3M over this period, it takes a lot more to move the needle. Pulling in 10K articles in 2000 would have increased your share by 1%, now it takes 30,000 articles, so similar numbers of journals moving would make less of an impact.
The problem of tracking journal to publisher relationships over time seems like a solvable one given how many parties are interested in this and likely already have some data to hand. A ROR like registry for publishers and their imprints (past and present), and then a mechanism to store that identity somewhere, either at the DOI level or at a minimum a publication year. Perhaps CrossRef could accept these identifiers in addition to pointing to where the content is currently hosted?
Makes sense, but the question would be in filling in the back data. Has anyone been with that publisher long enough to remember when journal X moved to (or from) their platform? Would work going forward though….
David – I imagine that Ulrichs would maintain historical records about which titles belong to which publishers, although whether the expose that information in their interface or API I do not know…
Interesting comparison with what I found in Crossref data in 2020 – I think the trend I was seeing was quite different https://clearskiesadam.medium.com/sizing-the-journals-market-with-crossref-fd8f50f4ff3
Really interesting! I suspect the difference is in the expansiveness of your data set and the limited nature of mine. Crossref DOIs include all sorts of things that aren’t journal articles — did you limit your study to just journal articles, or were things like books, book chapters, standards, preprints, grants, peer reviews, databases, datasets, or the vaguely worded “components” included?
I limited things to WoS journals (i.e., those with Impact Factors), and also removed meeting abstracts from my data (which is as many as 300-400K articles per year). You would have picked up the much wider world of all sorts of smaller or regional journals that issue DOIs (or predatory journals that do so as well — some do this as a false way of implying validity). Crossref seems to have around 19,000 members, so either my sample size is too small to see the full picture or your sample size has too low a signal to noise ratio.
Regardless, my data set doesn’t increase anywhere near as fast as yours does. Elsevier’s share is relatively flat across the 2020 – 2022 period though. Starts at 19.7%, bounces up and down between 20% and 22% until 2018 when it hops up to 24%, then a few down years back to 22%, up to 24% in 2021 and down to 21% in 2022. But I suspect what I’m seeing is that the aggregate increases in the top 5, 10, 20 are able to overcome the long tail increases that you see overcoming single publishers. Also, it’s worth noting that some of the publishers seeing big growth moved into my top 5-20 categories, so where you’d see them counting against your one publisher, I’d have them counting toward the dominance of the set that they’re now in.
Hi David, thank you for your reply. It was a while ago, but I think I probably would have limited the data to the ‘journal-article’ type. You’re right that there’s a big lot of uncertainty in the data I used there! I think it does look like there’s a different trend in Crossref data than in WoS data. I’m not sure why, but I guess publishers would prefer to target journals already indexed by WoS for acquisition, and that would mean that market-growth outside of WoS results in less consolidation.
Interesting write-up, and timely too. Thanks for doing this! Interesting to see parallel patterns between our preprint (intersect of WoS + Scopus) and your WoS-only analysis in terms of total articles annually.
Per Fig 2, if you could check my understanding… doesn’t it show the consolidation is taking place almost entirely in the Top 5? I suppose MDPI/Frontiers aside, as they grew per journal in that time. But the paralleling of lines and growth spikes in the Top 5, 10, or 20 just suggests the Top drive the change primarily, no? And no matter what year you look at, the 6th-20th add a fairly consistent proportion of articles?
Thanks!
Yes, I think you’re generally correct — the top 5 accounts for the bulk of the consolidation, although it varies year to year. If all the consolidation was in the top 5, then when the top 5 goes up by 2%, then the top 10 and top 20 would similarly only go up by 2%, correct? And that happens some years, but in other years the top 10 and top 20 go up significantly more than the top 5.
For example, 2002 — 2003, the top 5 goes from 41% to 43% (31,161 more articles), the top 10 from 50% — 52% (36,566 more articles), and the top 20 from 57% to 59% (36,755 more articles). In that year, the bulk of the consolidation was indeed in the top 5 (31,161 of the 36,755 total increase in articles).
But other years, say 2017 — 2018, the top 5 stayed flat at 52% (51,699 more articles), the top 10 went up from 63% to 64% (82,239 more articles), and the top 20 went up from 72% to 74% (101,842 more articles). In that year, there was nearly as much of an increase in articles outside of the top 5 as there was within it (52,699 articles and 50,143 respectively).
Overall the top 5 went up 22%, the top 10 28%, and the top 20 29%. So yes, the bulk of the consolidation was indeed in the top 5% but not entirely limited to it.
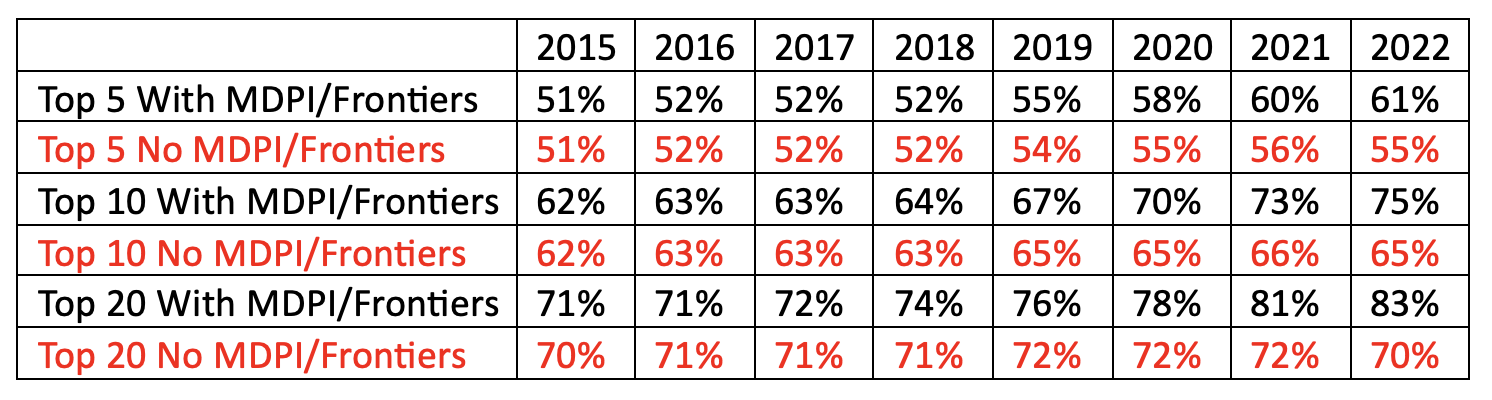
Thanks! Your note and the timeframes there do make me curious what the analysis would look like if you removed MDPI and Frontiers, given their significant rise in time periods like 2017-2018. If the goal is to look at consolidation of journal articles, then removing the special issue-associated hyper-growth from these groups might give a… not ‘better’ sense, but different view on where consolidation itself is taking place? Absent MDPI and Frontiers, is the consolidation from 2000-2022 basically entirely in the Top 5 publishers circa 2000?
Will take a look.
Here’s a comparison with and without MDPI and Frontiers. I started with 2015 to save myself some work as that’s when MDPI first enters the top 20. The numbers show not much of an impact until around 2018, and then, quite a bit:
Hi, David, Thanks for the detailed analysis. In addition to the below publishers, what other publishers are on the top l0 list?
Elsevier
Wiley
Springer
LWW
T&F
MDPI,
Frontiers,
The top lists vary year to year. For 2022, the top 10 consists of (in order, largest to smallest):
Elsevier
Springer Nature
MDPI
Wiley (includes Hindawi)
Taylor & Francis
Frontiers
Sage
IEEE
Oxford University Press
American Chemical Society