The world production of scientific literature continues to grow, at an annual rate of 2.8% per year, according to the 2014 edition of the National Science Foundation’s Science and Engineering Indicators. The growth rate for each country varies considerably, however.
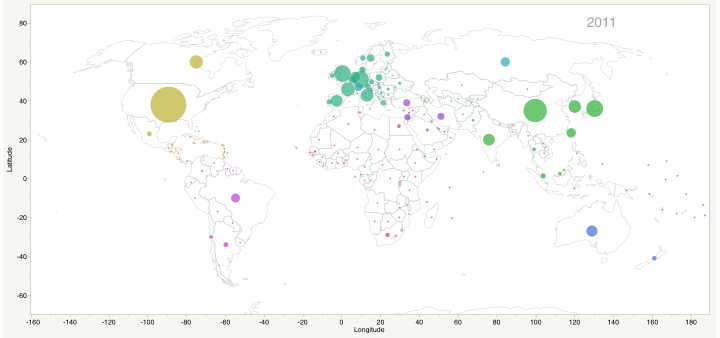
Between 2001 and 2011, China’s global share of articles rose from 3% to 11%. Brazil and India’s global share also grew by about 1%. In contrast, the United States’ share dropped from 30% to 26%, and Japan’s share fell from 9% to 6%.
Using the report’s country production dataset (Table 5-26, which counts fractional authorship, meaning, that if a paper were authored by a US and China-based researcher, each country would receive .5 article counts), I mapped article production to a country file that specified the average latitude and longitude for each country. Country names and borders change over time (e.g. Yugoslavia, Congo, Burma, among others), and some locations may include variants (e.g. Vatican City is also known as the Holy See, and some datasets specify England while others the UK). With a little patience and some squinting, you can arrive at a map that would be acceptable to most publishers.
The following map is a bubble plot overlaid with a geographical world map. If your browser supports Shockwave files (.swf), you can view it as an interactive animation, visualizing the changing output over time. Some bubbles get bigger, others shrink. Keep your eye on China, South Korea, India, and Brazil. You can focus on a particular region on the map by dragging the latitude or longtitude (X and Y axes) and then selecting Zoom Inward from the pull-down menu located in the upper left corner. The size of bubbles and the speed of animation can be controlled from the bottom sliders.
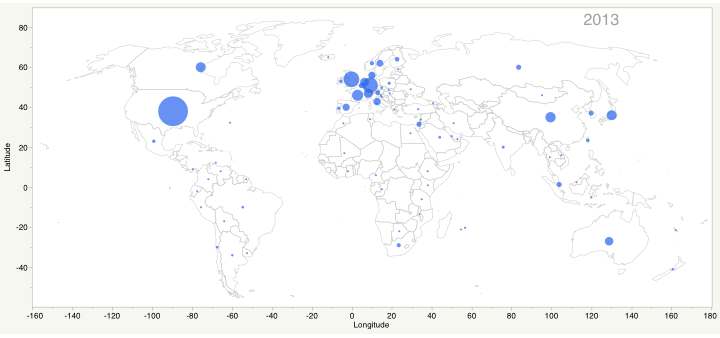
The technique of mapping country production data can also be done on a journal level as well. For example, the following map plots publication in Science and Nature using Web of Science data. While China comprises a very large share of global authorship, its share in the top multidisciplinary journals is much smaller. Science and Nature are still dominated by authors from the US and Western Europe. In 2013, China-based authors ranked 5th, with 136 papers (4% of total). In contrast, the United States had 1125 papers (34%), Germany 298 (9%), United Kingdom 257 (8%), and France 136 (4%). Compared with the changes in global article production, an animated version of Science and Nature article output looks much more static.
If you are more interested in the trends in article and patent production, Thomson Reuters published a very good report in April for the G20 economies. Andrew Plume at Elsevier also published an excellent overview of the rise in Chinese science in 2011.

Discussion
12 Thoughts on "Visualizing World Article Production"
Interesting that India’s share is increasing
It is part of the economic revolution in many countries. For example, India is a now a world leader in software development.
Of course, quantity doesn’t automatically imply quality. Is there any data that shows the impact of articles from growing countries like China, India, Brazil, etc? (Isnt’ article piracy also a big problem in these countries?)
Yes, the report does look at the citation impact by country, overall and broken down by field. See the subsection “Trends in Highly Cited S&E Literature by Country” and look at the tables, specifically 5-57. http://www.nsf.gov/statistics/seind14/index.cfm/chapter-5/c5s4.htm#s3
We also looked at this in the 2013 report BIS commissioned from Elsevier (see https://www.gov.uk/government/publications/performance-of-the-uk-research-base-international-comparison-2013). The entirety of Chapter 4 “Research Outputs” is relevant here, but the particular point about shifting citation impact across countries is addressed in Figure 4.6 (pg. 40) and 4.8 (pg. 42). (Disclaimer: I helped write that report, too).
The Convoco Geographies of World Knowledge report (I believe 2011 is the most recent edition) provides this kind of view, plus many other interesting perspectives.
Historically, annual growth of scientific literature has been more robust — around 5% — for more than 300 years. The real news might be “growth attenuated!” Tell us where and why. Or, you might get a different picture from less selective, discipline-oriented databases.
Albert, the literature routinely reports an historical growth rate of between 2-3%; however, that rate does vary over time. see: http://blogs.nature.com/news/2014/05/global-scientific-output-doubles-every-nine-years.html
Looking at the methodology secttion it looks like the article, journal, and coauthorship information is coming from Thomson Reuters and the Science Citation Index (SCI) and Social Sciences Citation Index (SSCI) (http://buff.ly/1x6FVYc) which says that “English is the universal language of science. For this reason Thomson Reuters focuses on journals that publish full text in English, or at very least, bibliographic information in English” (http://wokinfo.com/essays/journal-selection-process/). Presuming that there are relatively more smaller/regional/national english journals included than similar Chinese journals this is probably underestimating the growth of Chinese articles.
Likewise, Brazil has a lot of Portuguese language journals.