Author’s Note: Many years ago, my boss at the time remarked that if you want to point out a silly argument, all you have to do is to quote it verbatim. She was both right and wrong, because the silly argument will be believed by those who believe it and mocked by those who don’t. I offer this preface to my 2014 blog post on baseball statistics and altmetrics for anyone who needs a flashing sign that says, “Satire! Satire! Beware! Protect your children!” That sign is flashing now. This post is dedicated to all those who set out to measure the immeasurable. While I have your attention, let me mention that I am now working on a post that definitively resolves the debate as to which band was better, the Beatles or the Rolling Stones.
I took advantage of a special opportunity to study altmetrics recently. My kid was graduating from college in upstate New York, and I built into the trip an extra day to visit Cooperstown, home of the baseball Hall of Fame and the spiritual center of the altmetrics movement. Baseball, as fans and dispassionate observers know, is a game of statistics, and statistics are the national pastime.
Part of the reason that statistics have become such a big part of baseball is that there is some growing discomfort — call it post-modern unease — that perhaps the greatest of the greats were propped up by myths and folklore, stories of charisma instead of the hard data of performance on the field. Often human judgment and other superstitions were deployed in the place of statistical correlations, and out of this subjective stew came a list of the usual suspects: Ty Cobb, Babe Ruth, Warren Spahn, Ted Williams, Mickey Mantle — Mickey Mantle! — Willie Mays, Henry Aaron, Ichiro Suzuki, and a small number of other familiar names. If we could get our hands on the right measurements, we would assess baseball greatness differently, and the legendary heroes of yesteryear would be shown to be just that, legends.
For many decades, the standard measure of a ballplayer’s impact was batting average. No one really disputes the value of this metric; what is in dispute is whether it tells the entire story. A .300 hitter is, well, a .300 hitter, someone who reliably manages to hit his way on base almost a third of the time, either driving in runs or putting himself in a position to score. Had the community stopped there, however, we would be stuck with the uncomfortable fact that no one had hit .400 in many decades (Ted Williams hit .406 in 1941), which could lead us to the unlikely but oddly satisfying myth that baseball players were better once upon a time. No, batting average tells a story, but it does not tell the entire story.
To batting average we have to add other ways a player gets on base, which gets us to the on-base percentage, a measure that makes the true but unromantic point that a walk is as good as a base hit. But even there we know there is more: it’s not just a matter of getting on base but also of how many bases a player crosses. This then allows us to bring in the hard numbers for extra-base hits and home runs, through the slugging average. Suddenly someone like Mantle, who only (!) batted .298 over his career looms larger, as his impact is now lifted by the achievement of 536 lifetime home runs. We are comfortably in the world of altmetrics now, where we find ourselves measuring more things and establishing new sets of correlations.
To be the best player means living and playing in context; a batter hits not only against a pitcher but against a particular pitcher. To the remarkable record of Carl Yastrzemski or the now-dominant Miguel Cabrera, we have to factor in whether those performances would vary if pitted against a Bob Feller or Cy Young. It takes nothing away from Joe Dimaggio — or does it? — to say that he never had to bat against Mariano Rivera. So as we begin our analysis of Stan Musial, we must take each pitcher he faced into account; and from there we have to determine where that pitcher was in his career: The young fastballer? The canny veteran? And how much of the average for Pete Rose can be accounted for by looking at the weary efforts of players in the second half of a doubleheader?
This prompts an entirely new set of questions that have to be built into our model. It’s one thing to get a base hit, quite another to get a hit when someone is on base. How do we factor in the “clutch” factor? And what about the inning of a game when a batter successfully connects with the ball, the ability of a pitcher to strike someone out late in the game, the vexed question of games called on account of rain, and the moral ambiguity posed by switch hitters? Did a particular player steal a base on a full count or earlier in the at-bat, giving the batter more time to get a hit and drive the base runner home? It’s not enough to say that Jackie Robinson stole bases. We have to know when, how many, and at what time of day.
A great hitter, in other words, is not an abstraction but a set of quantifiable performances that take place in specific contexts. A right-fielder may lead all other right-fielders in sacrifice flies, but the even more important statistic is to lead in sacrifice flies in a particular inning, with the score tied, against a specific pitcher, on a balmy day in July. When we look at the data closely we see the deconstruction of our heroes into the sets of measures and exploited opportunities that they are.
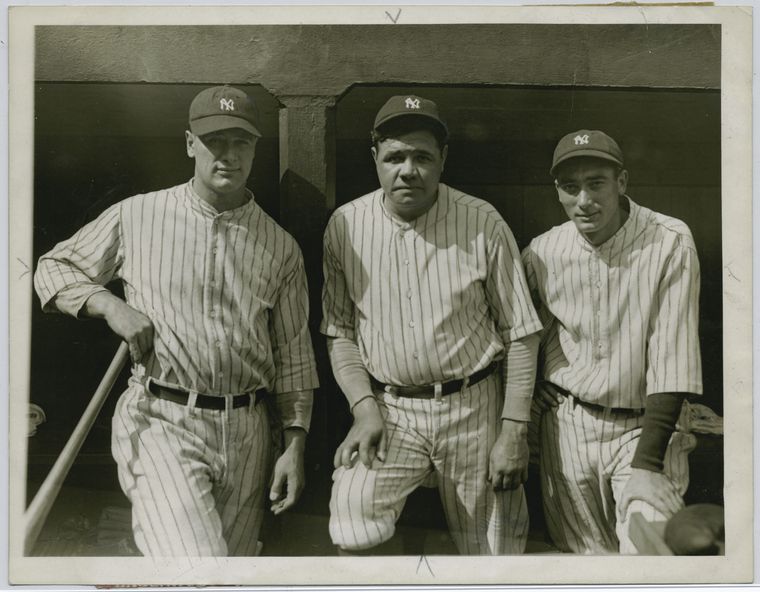
The irrefutable evidence of this is given pride of place at Cooperstown, where the baseball museum includes an exhibit of Roger Maris. Maris notoriously hit 61 home runs in 1961, breaking the beloved Babe Ruth’s record of 60. Maris’s record, however, is marked with an asterisk to denote that the 1961 season had 162 games, whereas 1927, the year Ruth set the old record, had only 154. Well, who is the greater home-run hitter? Does it matter that Ruth in 1927 had more at-bats than Maris in 1961? Is the number of games the right metric? The number of at-bats? The number of pitches thrown? And do we factor in that Ruth had Lou Gehrig batting behind him while Maris had Mantle? What pitcher would be willing to pitch around Ruth or Maris knowing that Gehrig and Mantle were lying in ambush? That asterisk is an expression of humility, as it marks the point where one statistical calculation runs afoul of another.
I have barely scratched the surface of the statistical analysis of baseball, but professionals have drilled into this in depth, beginning with Nobel Laureate Bill James. This mode of analysis was brought to a wide audience with the publication of Moneyball; a movie version followed. Moneyball shows how the incorporation of statistics into the management of a team could lead to success. Before Moneyball who knew that Kevin Youkilis could make the outstanding contribution he did or that the otherwise hapless Oakland Athletics could win a pennant? Statistics could be brought to bear on the real world and change the world. The lesson is clear: quantify everything; whenever you see two numbers, add them together; never judge, only deduce.
The success of Moneyball has led other teams to work with the statistical method. Now we find that what was once the competitive advantage of the Oakland A’s is the norm everywhere. Statistical analysis of baseball, in other words, is no longer something that sets one team apart but is simply the cost of doing business; it’s part of the overhead. But this foray into quantitative analysis has taught us something. It has broken down the legends of baseball into their component parts; it has substituted analysis for intuition. And now, after this analysis, we can see what the numbers tell us so clearly: the great players were those with names like Cobb, Ruth, Spahn, Mantle, Mays, William, and Suzuki. We never would have known this otherwise.