There are many things to remember about this week’s presidential election in the US — vast amounts of money, a polarized electorate, an empty chair, and much more. But one lasting change may be the emergence of a truly viable meta-analysis of polling and projections courtesy of Nate Silver and his FiveThirtyEight blog.
But getting the story right is important.
A post-election article by Dan Lyons on ReadWrite yesterday sought to make the case that the accuracy of statistical analyses made by Silver for the US presidential and Senate races is a sign of how “big data” will end the era of mystical predictions:
This is about the triumph of machines and software over gut instinct. The age of voodoo is over. The era of talking about something as a “dark art” is done. In a world with big computers and big data, there are no dark arts.
Lyons goes on to conflate what Silver did with other so-called “big data” triumphs, like when Big Blue defeated Kasparov (Silver covers this in his book, and a software bug might have been more important than any database in upsetting Kasparov). Chess is an interesting game, because it is bounded — it has finite data. Processing speed was responsible as much as data for the triumph of Big Blue — the data were never bigger than the mathematical possibilities of chess. The speed of processing made that finite limit approachable in chess time.
However, Silver’s approach didn’t use big data, but a relatively small, carefully curated data set consisting of a set of polls, and a lot of discipline, as he outlines in his methodology section on the blog. The factors he manages while assembling and analyzing the data include:
- Recency — More recent polls are weighted more heavily
- Sample size — Polls with larger samples receive more weight
- Pollster rating — Pollsters committed to disclosure and transparency standards receive more weight
These results are then adjusted based on a few factors:
- Trendline adjustment — If old polls haven’t been replaced, they are adjusted to reflect the overall trendline
- House effects — Some polls tilt right, some left, and this adjustment mitigates those effects
- Likely voter adjustment — Polls of likely voters are given a lot of credence
There are other steps outlined, which you can explore further if you’d like, but the two most important are the least mathematical, yet they are vital to the integrity of the process — Silver believes in publishing and standing behind his numbers, because the process of preparing for publication and anticipating criticism helps to ensure better analysis.
To underscore the relatively limited size of the possible data set, Silver tracked one presidential race and at most 100 Senate races, and various national and state-level polls. That’s not big enough to qualify as “big data,” which is defined as data sets that are:
. . . so large and complex that it becomes difficult to process using on-hand database management tool.
There’s even physical evidence that Silver’s not dealing with “big data” — the FiveThirtyEight forecasts were updating on his laptop in the Green Room as Silver was interviewed on Monday night’s The Colbert Report.
Silver himself is skeptical of “big data.” In his book, “The Signal and the Noise: Why So Many Predictions Fail, but Some Don’t,” which I reviewed last month, Silver writes:
. . . our predictions may be more prone to failure in the era of Big Data. As there is an exponential increase in the amount of available information, there is likewise an exponential increase in the number of hypotheses to investigate. . . . there isn’t any more truth in the world than there was before the Internet or the printing press. Most of the data is just noise, as most of the universe is filled with empty space.
Lyons is comparing Silver’s level-headed approach with a notoriously non-level-headed approach — namely, pundits. Most pundits spout statistics but don’t understand the field of statistics or how to practice it. They are entertainers, not analysts. Therefore, they are held to a completely different standard — ratings, not accuracy. If there were accountable for accuracy, they would all be fired tomorrow, because when it comes to accuracy, they can’t beat the flip of a coin. And they definitely weren’t accurate in their assessments of Silver.
Lyons nails one aspect of the aftermath of the election:
Silver has exposed [pundits] for what they are, which is propagandists and entertainers. And that’s fine. We still need entertainers. Computers haven’t learned to do that yet.
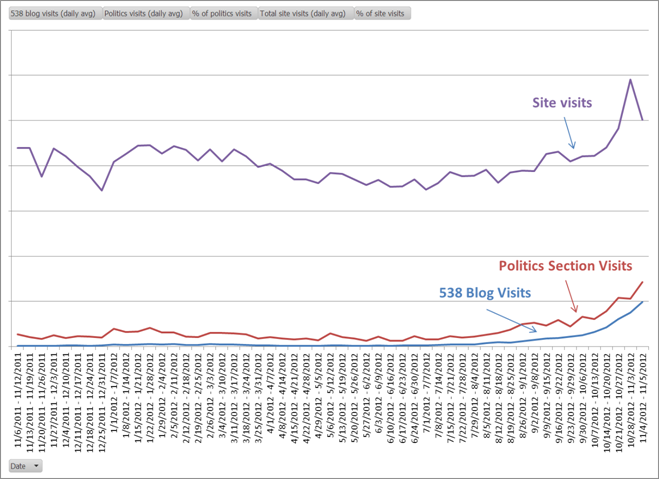
However, the New York Times found that Silver’s FiveThirtyEight blog did prove entertaining to many people, driving up traffic as the election approached:
Small data, careful curation, astute and recursive analysis, public accountability, the nerve to place bets and stand behind your projections and data — those are the things that make for good and reliable analysis. It’s not big data. It’s the audacity of competence.


Discussion
32 Thoughts on "Math and Discipline — Why Nate Silver's Accuracy Isn't About "Big Data""
Nicely put Kent. Ironically Lyons seems to be what he decries namely a pundit who does not understand statistical analysis. But some pundits do understand at least a bit, like you and me for example. Nor do I agree that human analysis is obsolete. The problem lies when analysis becomes unsupportable prediction. That is entertainment.
“Big Data” has become a buzzword and as such the term is starting to show up in contexts where it has not relevance. There is a real set of technologies (Hadoop) and techniques (Map Reduce) behind the trend that is collectively called Big Data. Big Data refers to the processing, and subsequent analysis, of extremely large data sets and, increasingly, real time data streams such as those that emanate from social networks, science instruments, financial systems, and other systems that produce vast quantities of data. As you note, what Nate Silver does is fairly straightforward and can be done with an Excel spreadsheet and a few simple formulas. It is most decidedly not Big Data. It is just plain data. Anyone with a bit of statistical knowledge and an ordinary computer can do the same thing. Which is, in a way, what makes the Nate Silver story so remarkable.
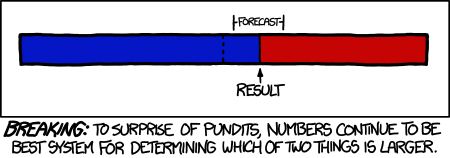
As XKCD has eloquently put it, “Numbers continue to be the best system for determining which of two things is larger.” http://xkcd.com/1131/
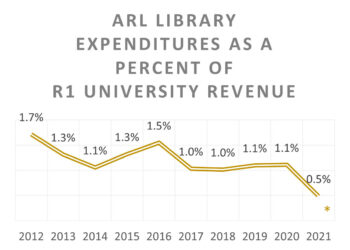
Too good! I updated the post’s graphic to show this cartoon. A treasure of sense.
Your link http://venturebeat.com/2012/11/07/boy-they-were-wrong-critics-called-nate-silver-a-numbers-racket-and-a-joke/ yields page not found. Current URL seems to be http://venturebeat.com/2012/11/08/boy-they-were-wrong-critics-called-nate-silver-a-numbers-racket-and-a-joke/
Fixed. Thanks!
Reblogged this on Progressive Geographies and commented:
Good piece on Nate Silver’s methods. And a great line about ‘the audacity of competence’.
Very nice analysis. However, you may be fighting a losing battle against this particular meme:
http://strata.oreilly.com/2012/11/2012-election-big-data-journalism-obama-data-campaign.html
To be fair, this one does seem to draw a distinction between the kind of careful analysis that Silver did and the kind of data-intensive/data-mining effort described by Michael, and used by Obama’s campaign to help raise money, target voters in contested states, and win the election.
I particularly liked John Scalzi’s response to Nate Silver’s level of success:
I understand no one likes having to face reality, when reality doesn’t give you what you want. But in the case of Silver, Wang, et al, modeling reality didn’t mean “Making guesses based on what I want to happen,” or (in the case of the now hilariously named unskewedpolls.com) “starting from a political point of view and then fiddling with things to get the desired result.” It meant “using a transparent system of statistical analysis and accurately reporting what it tells us on the probability front while simultaneously pointing out where errors can and do occur.” Strangely enough, it makes a difference.
Having read more and more studies about scholarly publishing, that sounds like awfully familiar ground. Basing studies on wishful thinking extends far beyond the realm of politics.
But if you go deeper into the output of his “model”, you will see that if the outcome was Obama got anywhere from about 190 to 390 electoral votes, he was covered. He can say he predicted it.
I gotta like them odds.
What Silver published was much more specific, and he missed it by a whisker. Say what you will, but that’s the story here.
No, you are focusing only on the mode/mean and not the entire distribution. A Monte Carlo simulation (and that is what this is) will give you a distribution of outcomes. The only way to check it is to repeatedly test it, which in this case means we would have to have multiple elections.
Again, he said that Obama would end up with something between 190 and 390 EVs. There is very little risk in that as that would cover nearly every election this country has had.
No, what Silver published was very specific — Obama would receive 313 electoral votes, Romney 225, and that Obama would receive 50.8% of the popular vote to Romney’s 48.3% — both very specific predictions. In the Senate races, he predicted Warren would beat Brown in MA; Donnelly would beat Mourdock in IN; McCaskill would win in MO; etc. I’m focusing on where he put his money and his mouth. You can say all you want about Monte Carlo and distributions and so forth, but ultimately, Silver makes a pick, and gets as specific as possible. I never heard him say that about the electoral votes. Do you have a link? Can you prove it? What he published in the New York Freaking Times was 313, 225, 50.8%, 48.3%. How much more public, specific, and on-the-hook can you get?
I really don’t see the point in what you’re saying, except maybe you think he was somehow disingenuous? I think he showed a lot of integrity by making picks and predictions that were both specific and almost completely correct (and surprisingly precise, even).
Oh Kent, this is so easy. Go to the blog and look at it. Sandwiched right in the middle of the 313/225 50.8/48.3 numbers on the right hand side is another chart that says a 90.9% chance that Obama would win. How can anyone be wrong on that? Unless he say 100% that Obama will win, then he has wiggle room.
But there is more. Scroll down to the “Electoral Vote Distribution” . This is what I was referring to earlier, but it is also where the 90.9% I just quoted came from. This plot shows that a very wide range of outcomes could still occur and be within the model’s prediction.
Scroll further down and look at the lines under “Scenario Analysis”. There was a 0.2% chance of an electoral tie. If that happened, well then Nate predicted that. There was a 13.6% chance that Romney won the popular vote. If that happened, well then Nate predicted that too, as well as a 5.3% chance that Romney would win the popular vote and lose the electoral vote.
Don’t you see: Nate predicted all manners of outcomes, not just the which state would go which way. Is there anything that he didn’t predict? Did he anywhere say there is no chance of a certain outcome? If not, then his model is not falsifiable, which means he can NEVER be wrong.
Again, I don’t know what you’re trying to demonstrate here. Silver is about probabilities. In a reality as bounded as an election, there will be one of a small set of possible outcomes — there is a 100% probability of that. But within the 100%, what are the probabilities of certain outcomes? That’s the question. And what outcomes did Silver find to be the most probable? Those that occurred. That’s the strength of his model.
If you really think that estimating the probability of every possible outcome demonstrates anything other than statistical rigor and discipline, then you are really clueless about how statistics and probabilities work. And I’d suggest you stop banging this drum because you’re only drawing attention to the fact that you don’t understand how probabilities within a proscribed and bounded set of options work.
Again, how can you prove his model wrong?
4 years ago, he did not achieve the same closeness in the mode prediction to reality, but did he or anyone else say he was wrong?
How can he be proven wrong?
If he can’t be wrong, then what is the point of his output?
The outcome of a Monte Carlo simulation is a distribution. You cannot determine the accuracy of a distribution by testing it just 1 time, unless the result is outside of what the simulation predicts. That did not happen here, so while the model was not falsified, it was not verified either.
My God, you’re both tendentious and tone deaf to feedback.
First, Silver’s 2008 predictions were very accurate:
Silver’s final 2008 presidential election forecast accurately predicted the winner of 49 of the 50 states as well as the District of Columbia (missing only the prediction for Indiana). As his model predicted, the races in Missouri and North Carolina were particularly close. He also correctly predicted the winners of every U.S. Senate race. The accuracy of his predictions won him further acclaim, including abroad, and added to his reputation as a leading political prognosticator. [emphasis mine]
His model would be inaccurate if it routinely stated a strong probability of an outcome that did not come to pass. So, if he’d stated that there was a 90% chance of a Romney win, and projected Republican winners in Senate seats ultimately filled by Democrats, his model would be proved inaccurate — unreliable, biased, ill-founded, untenable, unbelievable, bogus. Instead, his model yielded a number of probabilities that were matched by reality, trended toward reality as more data emerged, and all — from Senate seats to the Electoral College — proved predictive. If only 30% of his projections had been right, nobody would be talking about him (unless his name was Gallup).
He could have been wrong. He wasn’t — not in 2008, not in 2012. Again, I don’t think you have done your research or understand probabilities, so really you should stop commenting on this.
I would like to predict you might understand this if you stopped to think about it and got your facts straight, instead of recycling the same old vacuous assertions that are nothing more than meaningless sophistry. But you might just prove me wrong with your next comment.
Actually John is right in an important way. Specifying a probability distribution is not a prediction because no specific occurrence can falsify it. For example the NWS says there is a 30% chance of rain today. This is consistent with both rain and no rain. It is a proposed description not a prediction.
In no case is the mean predicted; it is just the mean. In fact the mean of a distribution is unlikely to occur, there being so many other possibilities. (See my comment below about the fallacy of the mean.) Probabilistic descriptions can only be falsified in the long run based on many similar situations and then it is the method that is falsified in the sense that the proposed distribution is incorrect,
Regarding probabilistic descriptions as forecasts of specific events is a classic conceptual confusion. Silver did not predict the outcome of the election; he just said that what happened was within the likely range. There is a difference.
I’m checking out of this meaningless discussion. Silver’s model made “bets” a few dozen times on election night — he didn’t say he couldn’t lose, just that he was 90% likely to win. He showed this very publicly, and tens of thousands of people followed him and were going to hold him accountable for his predictions. They were processed as predictions with a little uncertainty in them.
Want better odds? Good luck finding them. There are a few other sites that have models of their own, and some that actually take wagers on their models. Silver won all his “bets” (except for one obscure and poorly studied North Dakota race, which was very close even then).
You can talk all you want about distributions and so forth — they occur everywhere, from cards to baseball games to elections — but when someone can wrangle the data into statements of probability that come out on top so consistently and in a way that’s more accurate than competing attempts, your academic points become meaningless in application. I get what you’re both saying — I just think those points are moot in a very uninteresting and unhelpful way, and should be subjugated to the fact — FACT — that Silver’s model works very reliably. Isn’t that what we want?
John is trying to invalidate a model that has a high degree of correlation with reality. That’s what models should have. If he were truly interested in using data in a way that accurately approximates future behavior, he should be praising Silver (and learning from him). That’s the only useful response, in my pragmatic opinion.
Suit yourself, but now you have changed the argument to his model having made lots of correct descriptions. Given all his descriptions and the actual results we can in fact estimate the models skill. Given the same for the other models we can do the same and the cases need not even be the same. But we do not have that data and no one has done this analysis.
Winning a poker tournament or two does not make one the best player in the house. This is not to denigrate Silver just to maintain perspective.
I didn’t “change the argument,” but kept John from changing it. My argument was that a good way of meta-analyzing poll data had emerged, it was quite reliable, and it was published for accountability. He wanted me to accept his argument that by using a probability model, Silver was seeking to escape accountability. That’s not correct. He was, BY FAR, the most accountable individual in the US projecting election results. Within a bounded reality with only a couple of dozen possible outcomes, most had at least a small percentage chance of happening (not all — many Senate race Silver projected to be 100% locks), but Silver was out there projecting specifics like “% of total vote” and “# of electoral votes.”
John wasn’t doing his homework (saying completely inaccurate things like “4 years ago, he did not achieve the same closeness in the mode prediction to reality” when in fact he did) and wasn’t willing to accept the specificity of Silver’s projections. He then said the model wasn’t verified because it had been tested only once. He was wrong on both counts, and that’s why I think his comments are complete and utter nonsense. He doesn’t even have the courtesy or personal integrity to a) drop it when it’s pure academic drivel or b) check facts before asserting them in public.
To paraphrase my favorite line from the movie “Cool Hand Luke” [What we have here is a failure to communicate], what we have here is a confusion of means and ends. The end here is a precise prediction (along with an estimated probability that the prediction is correct). Part of the means is Monte Carlo simulations, resulting in distributions with means and variances (please pardon my use of “means” in two different senses in the same sentence).
This seems like a good time to bring up what I call the fallacy of the probable mean. Statistical sampling theory actually says the probability of the mean value being true is zero but we ignore this inconvenient truth and use the mean as the best guess. The mean is often the only thing reported, but sampling actually gives us a mean and a distribution of confidence intervals. The 95% interval is often used for significance, but consider the smaller 49% interval. The true value is more likely to lie outside this interval than inside where the mean is. Taking smaller intervals makes the mean even less likely until at the limit the probability of the mean being true becomes zero.
Also, for what it’s worth, a chronicling of Dan Lyons steady decline from amusing humorist to cranky old man yelling at Apple to get off his lawn:
https://www.macworld.com/article/2013753/macalope-its-a-dirty-job.html
and here:
http://tech.fortune.cnn.com/2012/11/08/fake-steve-jobs-revenge/