The headline, “Scientists reading fewer papers for first time in 35 years” was published online in the news section of Nature by the astute science journalist, Richard van Noorden. This bold claim referred to a new, but unpublished paper, by Carol Tenopir and others who reported on a 2012 survey of reading habits of US-based academics. There are very few longitudinal studies of how scientists read and interact with the scholarly literature and this periodic survey is fundamentally important in understanding how changes in scholarly publishing have changed reading behavior.
Tenopir’s findings–the first time reporting a drop in reading–was indeed novel and newsworthy. Since the 1970s, scientists in each subsequent survey have reported reading more articles and these are the results we expect. When scientists have easier access to the scholarly literature, we expect them to consume more of it, not less. Even if scientists have given up walking to the library and perusing the shelves long ago, we’d imagine that recent changes in journal publishing since the mid-2000’s (open access publishing, broader access to papers from non-publishers’ websites and repositories like PubMed Central, article sharing services like Mendeley, easier remote login for scientists away from campus, among others) would continue to push reading up.
Of course, ‘reading’–if we define it by the attention of human eyeballs does not expand. It has a limit.
The figure in Nature that drew so much notice showed that reading was declining for the first time in 35 years, and when faced with data like these, everyone wants to explain it. Were scientists, like the rest of general public, becoming distracted in this age of mobile devices and social media and turning to Twitter and blogs? Just as the Superbowl turns many into a Monday morning quarterback, these results turned everyone into an armchair scholarly communication analyst.
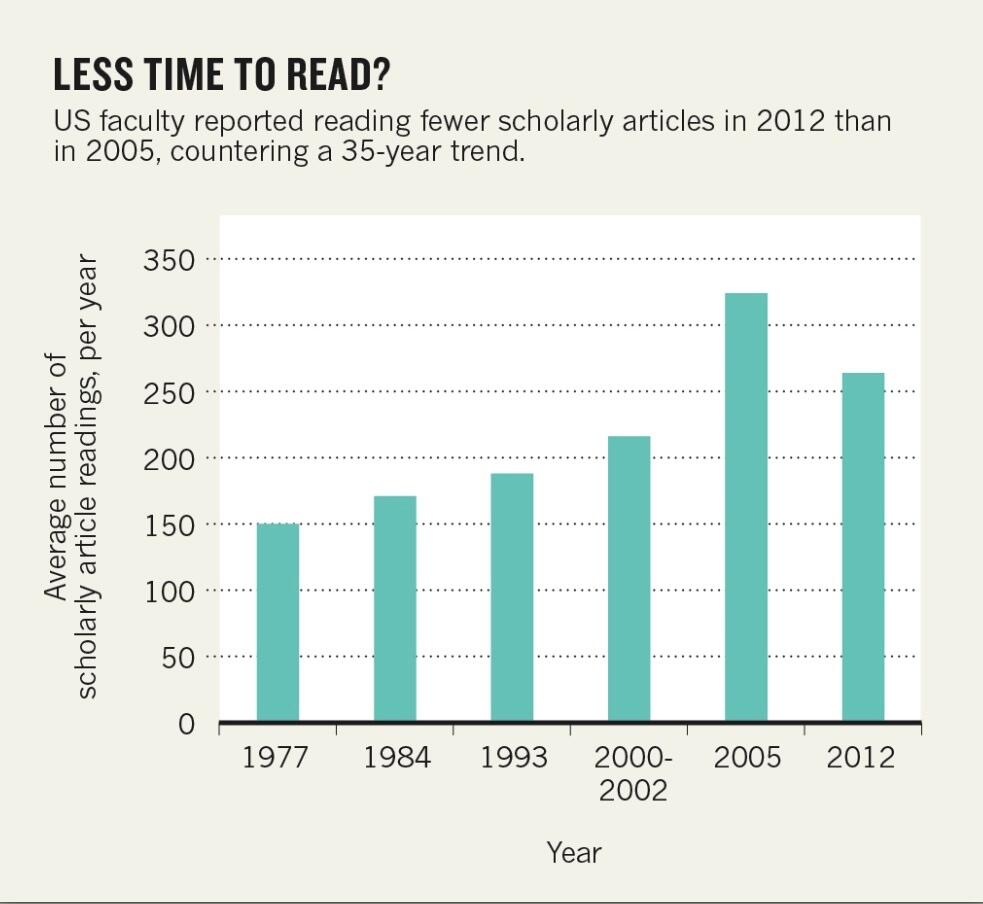
Before we continue with a statistical analysis, let us look at this figure again. Average numbers of reported readings were lower in 2012 than they were in 2005, but if we put less emphasis on 2005 results, we could simply be witnessing the extension of an ongoing linear trend. The headline, “Scientists Continue to Read More Articles, Survey Finds,” doesn’t seem very novel or newsworthy anymore, at least for Nature magazine.
According to the final manuscript, which was accepted for publication in an upcoming issue of Learned Publishing, faculty respondents were asked to report how many articles they read in the previous month. The researchers multiplied this response by 12 (to arrive at an annual estimate) and calculated the average response for each sample. This is what is reported in the figure above. Even a cursory glance shows that the average response in 2012 was lower than in 2005. Or was it?
If the researchers were able to get responses from each and every faculty member in the United States, then such a comparison from year to year would not require much statistical analysis–a comparison of averages would be sufficient. However, the researchers were comparing two different samples of faculty responses taken from two different populations of potential respondents. The 2005 survey received 1,304 responses (28% response rate), compared to 837 responses (8% response rate) in 2012. Both surveys were sent to faculty by their librarians and only one of the five institutions between the two samples was the same.
One could question whether the study suffers from sampling bias and response bias. For the sake of argument, I’m going to assume that these two samples are similar enough and therefore can be used for comparison purposes.
What alerted me that these two samples (2005 and 2012) may not be so different was a few lines from their results. The variation in reported reading responses was very high. In 2005, some faculty reported reading as few as zero articles per month to as high as 255–whether you can trust this self-report or not, this represents an estimated 3060 articles read per year for that one respondent.
But if you accept, again for argument sake, that these extremes are based on actual experience, Tenopir is dealing with a very skewed distribution that would be highly sensitive to extreme values. In cases like this, reporting the median would give a much better estimate of what most scientists are doing than the mean. For the same reason that economists report median family income–to avoid biasing the results by the incomes of a few super rich–I wondered whether reporting average reading behaviors was really the right way to present the data. If Tenopir’s data were reanalyzed, were scientists really reading less for the first time in 35 years?
Responding to my queries, Tenopir did reanalyze her data using medians and confidence intervals, and discovered that there was no statistical difference between 2005 and 2012. Faculty are reading about the same amount in each year. A correction was posted in Nature and I admire the integrity and professionalism of both the researchers and the journalist for correcting the record. I am also happy to be part of the self-correcting mechanism of science.
https://twitter.com/Richvn/status/431134951400960000
The headline for the Nature piece now reads “Scientists may be reaching a peak in reading habits.” And the first paragraph reads as follows:
A 35-year trend of researchers reading ever more scholarly papers seems to be levelling off. In 2012, US scientists and social scientists estimated that they read, on average, 22 scholarly articles per month (or 264 per year). That is, statistically, not different from what they reported in an identical survey last conducted in 2005. It is the first time since the reading-habit questionnaire began in 1977 that manuscript consumption has not increased.
But is this replacement narrative–that reading habits have reached a plateau–now accurate? In my view, it is not. While we know that 2012 responses are no different than 2005 responses, this view ignores a general linear trend in the rest of the data (figure above). We won’t know if the trend is “leveling off” until another sample is taken in another 5-7 years. Now, one could get wrapped up in the semantics of how the word “may” was used in the title and paragraph, but I feel that the journalist replaced a novel–but inaccurate–narrative with an equally novel–but inaccurate–one. Without seeing the data and relying on just the figure, my headline would have read, “Scientists still reading more each year. Digital publishing cited as factor,” but that is neither novel nor newsworthy. It does, however, fit in what what most of us know and expect from the data, newsworthy or not.
What do you think? Does the new data support a new narrative that reading has leveled off? Does anyone have data to support (or contradict) this theory? And for the editors and science journalists among you, how would you have dealt with this situation?


Discussion
15 Thoughts on "Are Scientists Reading Less? Apparently, Scientists Didn't Read This Paper"
The biggest problem I see with this study is that if I was asked how many papers I’ve read in the past month or year, I would not know how to answer it accurately.
A low ball estimate would be simply summing the number of unique citation I made on the journal and conference papers I wrote. A high-ball estimate would be the total number of PDF’s I downloaded. These two values are easy and reliable to measure. But how many papers I read besides the ones I cited and not counting the ones I downloaded but did not really read? That is very difficult to say. Therein lies the biggest uncertainty in the study’s data.
Another observation I would make of the study is that a bar graph is not the most informative way of plotting the data. It is the easiest to interpret for the intended wide audience, but not the most meaningful for the purpose of this study. I am not sure what would be better, I would try stacked histograms or something of the sort. Or I would ask a statistician for advice.
As the journalist who wrote this story, the way I should have dealt with it is very clear. I should have been more sceptical and checked out the statistics properly before publishing. Mea culpa and lesson learned, although it is one I thought I already knew very well. The paper had already passed the scrutiny of peer reviewers and been accepted for publication, but that is no excuse for my mistake.
On the ‘new’ narrative I have introduced, I think it reasonable for a journalist to read this narrative into the data. I do not believe that I am misleading readers; of course, we will have to wait another 5 years to see if the trend holds up. In the meantime, I’m very glad Phil was astute to catch the problems with the study, and that he has written this post opening up the debate.
This blog site, the Scholarly Kitchen, was in fact the first venue to publicly reveal some of this data and to discuss the narrative that time-pressed scientists have reached their peak of reading papers – and this before the manuscript had even been peer reviewed! Carol Tenopir did an engaging interview with Stewart Wills in September 2013 (http://scholarlykitchen.sspnet.org/2013/09/04/scholarly-kitchen-podcast-carol-tenopir-on-time-value-and-trust-in-scholarly-communication/), in which she revealed some of her results and discussed her theories. I heard that podcast, contacted Carol, and waited 5 months until her paper was peer reviewed and accepted for publication before I reported on it. Oh, if I had stuck to my own usually sceptical principles and taken just a few more days!
Richard: As a one time science journalist I like your new narrative, which changes the story from a fact to a question. That you did this is laudable. Of course Phil is to be congratulated for his detective work as well.
If the 95% confidence interval error bars had been included in the graph it would have been clear that we do not know whether the usage is level or dropping, or perhaps even still rising. The small sample and large variation makes these error bars very large. In such cases reporting the mean as a fact about the population is a common fallacy. The confidence interval is the statistical fact, not the mean, yet we see people trying to explain the mean as though it were true.
Note too that the large extrapolation from one month to a full year introduces another large uncertainty, because the month to month variation is probably quite large. High end numbers may be occasional literature searches and low end numbers work breaks. I wonder if, given this large extrapolation, confidence intervals can even be calculated? The sample collected (one month) is not the statistic reported (one year).
By the same token we also do not know if the prior linear trend actually exists. The interesting question is do we even know that the overall increase exists?
The lesson here is that statistical uncertainty is important.
Another, related, question has to do with whether we read the literature in the same way we used to. Or do we employ robots to scan the environment or rely on reputable bloggers and possibly achieve better focus resulting in fewer articles read but more productive reading.
I would like to see breakdowns of how many papers read were reviews, research reports, editorial, letters, and other informal communications. One review paper might be worth many reports, etc.
In any case, I believe the number of papers _not_read_ increased every year — inasmuch as the total of “papers published” increased. Isn’t that more significant in terms of the effectiveness of science spending, results, peer review?
Reblogged this on At the BookShelf.
One good possibility is that the definition of “read” is changing. Maybe reading an article used to mean actually “reading”, but now it might mean “I read the abstract and looked at the figures”. In other words, “I internalized that there is a paper on such a topic and what type of research was done, so that I can go back to it later if I want to.” I suppose this could be identified by asking how much time per paper was spent “reading”.
When HighWire did researcher interviews in 2012, we found that researchers reported reading 8-10 journals regularly. But in 2002 we asked that question and the answer was 2-3 journals. How could this be? Did Evelyn Wood do a special class for research articles??
What we found is that the definition of “read a journal” had changed. By 2012 it meant, “I read the email table of contents”. That probably wasn’t what it meant in 2002 we think!
John
Reading does not necessarily have to come from a physical book; online reading is also informative and sometimes even more useful. You can access information quicker and get a larger variety of views for certain things. Just because scientist have updated to online databases (like most people) does not mean they are not reading enough.
Papers read per month multiplied by 12! ….really?? are you kidding me? When did extrapolation of human behavior across time become basis of research? Everyone knows reading patterns are seasonal etc.
When the basic data generation process is faulty, what is the point in asking if the headline was right or wrong?
I don’t fault the methodology as much as the reaction to the results. I don’t believe you can label a change between two single years as a trend. I think that if the methods were the same or similar across all of the years, then it is valid to view the results from all of the years as a trend. And this trend is increasing. Frank Lowney’s comment about what constitutes a “reading”, I think, is more important in this age of increasing body of literature than applying a single month across a year.