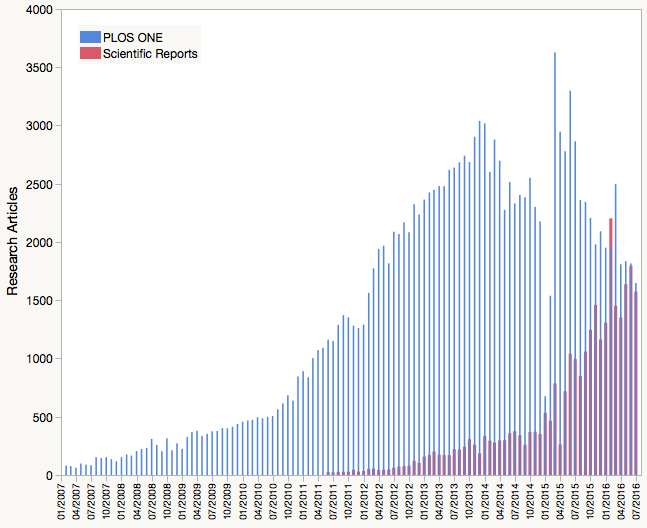
PLOS ONE is poised to lose its claim as the largest journal in the world soon, with rival journal, Scientific Reports, taking its place.
Scientific Reports, published by Springer Nature was a relative latecomer to the scene, and, at the time of its launch, many skeptics did not believe that there would be room for yet another multidisciplinary open access journal. Both Scientific Reports and PLOS ONE are run by an immense, diffuse group of section editors, accept papers without novel findings, and charge the same article processing charge (APC) — $1,495. A trader on Wall Street would claim that these journals were providing fungible commodity services.
But, are these journals really interchangeable? If so, what explains Scientific Reports growth at the apparent expense of PLOS ONE?
- Journal Impact Factor.
- Data Availability Policies
- Publication Delay
Journal Impact Factor (JIF). In the last (2015) release, Scientific Reports received a score of 5.228 compared to 3.057 for PLOS ONE. In addition, Scientific Reports has maintained a score above 5 for the last three consecutive years whereas PLOS ONE‘s JIF has declined. While many editors and publishers eschew the indicator, scientists consider the JIF as an important factor when deciding where to submit their work, according to Nature Publishing Group’s 2015 Author Insights survey as well as the recent University of California’s Pay It Forward report.
Data Availability Policies. In 2014, stronger data availability policies were enacted across all PLOS journals, requiring authors to make “all data underlying the findings described in their manuscript fully available without restriction, with rare exception.” All PLOS manuscripts must include a data availability statement and authors are strongly encouraged to make their data available in a public archive before publication. In contrast, Scientific Reports’ policy merely states that authors should share upon request. Research by Tim Vines has shown that the willingness and ability for authors to share data declines significantly with time, and having a weak data availability policy is only marginally better than having no policy at all. While advocates of open science argue for full data transparency, there is considerable resistance from the biomedical community, and freedom from a strong editorial policy may provide Scientific Reports with a competitive advantage.
Publication Delay. Anecdotally, colleagues told me that it was faster to get a paper published in Scientific Reports than PLOS ONE. To confirm this, I took the last 100 papers published in each journal and calculated the time from submission to acceptance, acceptance to publication, as well as the full publication process. Time to acceptance was about a month shorter for Scientific Reports, (median days = 99 [IRQ: 78–146]) than it was for PLOS ONE (132 days [IRQ: 100–173]). Although once accepted, PLOS ONE was able to publish the papers about a week sooner (19 days [IRQ: 14–23]) than Scientific Reports (27 days [IRQ: 25–28]). In all, the median time from submission to publication was 126 days for Scientific Reports and 151 days for PLOS ONE, a difference of about three weeks.
According to the 2015 Author Insights Survey, Chinese authors rate the JIF and Time (both time to acceptance and time to publication) as more important than other respondents. This is not surprising, as many institutions reward Chinese authors with monetary rewards for publishing in high impact journals, and publication numbers confirm these institutional rewards. For papers published since 2015, 39% of Scientific Reports authors were from China, compared to 18% for PLOS ONE (source: Web of Science).
In sum, given two large multidisciplinary open access journals with similar editorial structure and publication cost, authors appear to be favoring the one with the higher Impact Factor, faster publication time, and more lenient data availability policies.
As I’ve argued in the past, drawing vast numbers of submissions is not always the wisest business model for longterm success. PLOS ONE drew record submissions immediately after they received their first JIF. If the kind of author seeking publication in a megajournal is primarily motivated by the JIF, then the same downward turn observed with PLOS ONE is likely to happen with Scientific Reports as well. Given that the JIF reflects the publication preferences of authors publishing two and three years ago, we may see waves of authors oscillating between these two journals every few years.
An unpredictable publication flow and revenue stream through APCs will have very different effects on the two publishers. Springer Nature has an enormous, diversified stable of journals and revenue streams, which allows them to play a long-term strategy game with Scientific Reports. Annual revenue fluctuations with one journal are not going to put Springer Nature in financial trouble. In contrast, PLOS’ income is almost exclusively based on APC revenue, with 97% of their 2014 revenue coming from publication fees. More importantly, 91% of all 2015 papers published in PLOS journals were published in PLOS ONE, the remaining 9% split among six other journals. As revenue from PLOS ONE functions to subsidize the publication costs of these six other titles, downward pressure on PLOS ONE puts the entire organization at risk.
Given that the leading edge of the above publication graph reflects papers submitted in the winter and spring of 2016, the influence of the last Journal Impact Factor scores should start revealing themselves later this fall.

Discussion
28 Thoughts on "Scientific Reports On Track To Become Largest Journal In The World"
This is a win for open access. As PLOS stated in 2011, “Welcome, Nature. Seriously”. http://blogs.plos.org/plos/2011/01/welcome-nature-seriously-2/
Perhaps, but one wonders how they are handling the dramatic drop in revenue? It has to hurt a bit.
One way they’re handling it is by raising their APC price.
https://scholarlykitchen.sspnet.org/2015/09/29/plosone-hikes-pub-fees/
The Chinese numbers are interesting in their own right, perhaps enough for a separate analysis. Is there some sort of OA mandate at work here?
I would think that in China this is more Impact Factor-driven than open access-driven.
You forgot to mention that Springer publishes 116 scientific Chinese journals. Chinese scientific authors tend to cite each other and probably have an impact on the impact factor. Springer has an office in China -Peking- and an editorial presence. Springer actively participates in the Chinese scientific publishing arena.
Two more factors that might have some bearing on Scientific Reports’ growth come to mind:
4. Manuscripts rejected by PLOS ONE get accepted and published in Scientific Reports.
5. Looks good to have ones work associated with Nature, even if only at the URL level.
4. Manuscripts rejected by PLOS ONE get accepted and published in Scientific Reports.
Sasa, do you have access to any data on how often this happens?
“Although once accepted, PLOS ONE was able to publish the papers about a week sooner”
Does anyone know if Scientific Reports edit and send proofs to authors prior to publication? I was shocked to learn that PLOS ONE no longer does this and even refuse to make corrections to published material when they’re pointed out by authors. If Scientific Reports does take the time to more carefully proof before publishing, that could explain how PLOS ONE is faster.
I’m also curious what the Scientific Reports accept percentage is. Another criticism which seems to be snowballing related to PLOS ONE is that their peer review process has increasingly become weaker. Both journals seem to have the same basic policy as far as “we accept good science.” A lower accept rate by Scientific Reports may indicate that they are more rigorous in upholding that standard via peer review.
Acceptance rate at Scientific Reports as of 2012 (don’t have more recent data) was 55% https://peerj.com/articles/981/#results
No, it’s just speculation, but it wouldn’t be such a surprise, especially taking PLOS ONE’s less forgiving data availability policy into account.
My understanding is that they don’t actively enforce that policy, and instead leave things to the reviewers and review editor, so how many submissions they’re actually driving away is unclear.
Well, now we have a horse race.
This sort of journal merely perpetuates the excessive profits of legacy publishers.
Far better to publish in eLife or Royal Society Open Science. They are both free to the authors as well as the reader (for the time being anyway).
Given eLife’s different selection criteria and 85% rejection rate (http://www.nature.com/news/open-access-journal-elife-gets-25-million-boost-1.20005), I suspect that very few PLOS ONE and Scientific Reports authors would likely be able to publish there.
So we just need a lot more like that. We should not be promoting legacy publishers.
Probably depends on what you mean by “we” and “legacy publishers.” The Royal Society started their journal publishing program in 1665, yet you recommend them.
I recommended Royal Society Open Science, which is recent, and free for both authors and readers,
I certainly can’t grumble about the 130,000 full text views and 19,400 pdf downloads which my paper got there -it was published in volume 1, before the journal even had an impact factor. See http://rsos.royalsocietypublishing.org/content/1/3/140216.article-info
That’s the future of publishing, not Springer.
And also the past of publishing. A new type of journal from the oldest of legacy publishers. If they can learn a new trick, who’s to say that other old dogs can’t as well?
They are doing. But they charge far too much for them. That’s why I signed the Elsevier boycott. It would cost universities far less if they subsidised new journals (shouldn’t be more that $200 -300 per paper) just as the Royal Soc subsidises RSOS.
Interesting to me that nobody has brought up discipline issues as they relate to both journals/publishers. Like it or not (at least at present) PLoS is still known in many corners as primarily a life sciences and medical publisher, where Springer’s reputation is far more broad-based, discipline-wise. So why would anyone be surprised to see the number of papers being submitted to and published in Scientific Reports outstripping those in PLOS One, when the number of disciplinary areas with researchers who are well acquainted with the reputations of each publisher are so different?
I just did a quick single term search in both titles for four words. Here are the numbers of hits.
PLOS One: biology – 120,462, medicine – 104,045, business – 5,442, engineering – 37,011
Scientific Reports: biology – 3,448, medicine – 88,822, business – 60,691, engineering – 125,054
Springer is a well known commodity as a publisher in more subject areas than is PLoS, so I would think it likely that once Scientific Reports (as a newer journal) became better known in the researcher community that its submissions and papers published would outstrip those of PLOS One – Scientific Reports is drawing from a much larger group of disciplinary areas that are familiar with the journal’s publisher (Springer) than is the case with PLOS One (PLoS).
So maybe the reasons for the trends that Phil points out above are related to impact factor, data availability policies and time to publication, or maybe it’s that there are LOTS more people outside of medicine and biology who are more familiar with Springer than with PLoS and are more comfortable submitting to a mega-journal from a publisher with whom they have that greater familiarity.
OK, some of my data above are incorrect. When you search on the PLoS site and indicate you want to search just within PLOS One, that’s what actually happens, even if you simply repeatedly plug in different keywords one right after the other. But on the Springer-Nature site, the _first_ keyword search just within SR searches just within SR, but if you simply replace that keyword with a second one, as I did yesterday, the site switches over to searching across all Nature family titles, To search just within SR again for a different keyword you have to back out one level and enter your search term there OR indicate that you want to search in SR each time you enter a new keyword. WHY the site is set up that way is a mystery. But the bottom line is that my numbers yesterday from PLOS One were correct, but for the ones from SR, only the first number, the one from searching “biology”, is correct.
Correct results are:
PLOS One: biology – 120,462, medicine – 104,045, business – 5,442, engineering – 37,011
Scientific Reports: biology – 3448, medicine – 2965, business – 162, engineering – 4631
So without doing a search just over just more _recent_ content published in both journals, I don’t know whether the subject discipline favoritism toward the Springer-Nature title vs. the PLoS title that I speculated on yesterday exists or not. So Phil, your points may all be the correct drivers after all.
Sorry I didn’t catch yesterday that the Springer-Nature site was broadening the search parameters unless you specified limiting to Scientific Reports with EVERY search done.
The data sharing policy of PLOS One has no teeth. I have never seen them enforce it when authors flat out refused to share. So, policy or no, the two journals are functionally equivalent on data sharing.
The numbers along the X-axis of the graph are unreadable, primarily because they have a vertical position. I suggest to put them in a horizontal position. I also suggest a significant reduction in the amount of numbers listed along the X-axis (at the moment one at every tick). Both changes will dramatically improve the readability of this nice graph. I suggest that there are no longer posted graphs over here with numbers along the X-axis which are in a vertical position.
Writing out the time points on the graph in a horizontal manner would have required the X-axis to be massively extended (40 notations of 7 characters each), stretching things out to a point where the visual effectiveness and practical utility of the graph would be lessened, if not entirely destroyed. Given that the X axis labels are repeated time points (showing the first, fourth, seventh and 10th month of each year), the pattern should be fairly obvious to the viewer. One could potentially simplify the labeling by only showing the first month of each year, but given the space allotted, likely this label would need to remain in a vertical orientation.