When PLOS ONE hiccups, everyone notices. For smaller journals, a sudden drop in publication output in a single month may raise some eyebrows, but is usually explained by unpredicable events–unseasonably nasty weather, an editor of a special issue frustratingly behind schedule, a few authors not returning revisions in short order, for example. But for very large journals, like PLOS ONE, which published more than 31,000 articles in 2013 alone, stochastic events tend to dampen themselves out. Bad weather is regional; one tardy editor among more than 5,000 other editors is hardly noticed; a few late authors makes even less of a difference. PLOS ONE is playing a very large numbers game, so a sizable decline in published papers signals a structural shift and not a random blip.
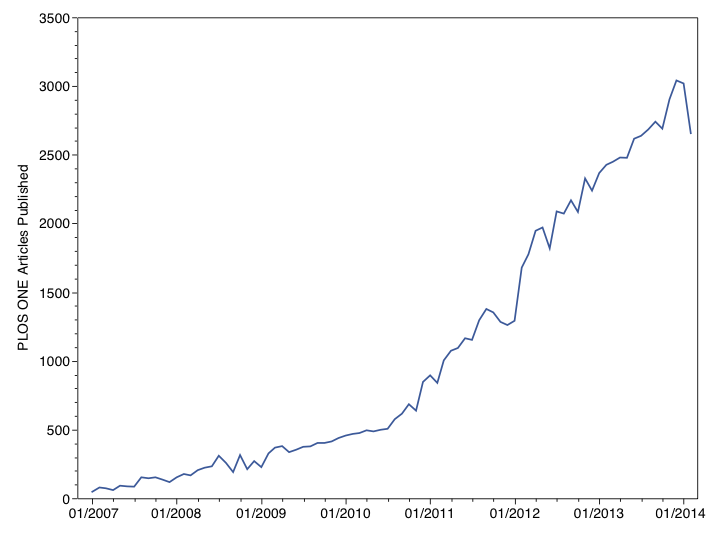
In 2014, publication output in PLOS ONE dropped by 12%, from 3019 published papers in January to 2657 in February. While this drop represents a decline of 362 papers in a month with just 28 days, publication output increased 3% during this same period in 2013 (from 2367 to 2427), and 30% in 2012 (from 1292 to 1679).
In a post written last June, just after PLOS ONE received its 2012 Impact Factor (3.730), I predicted that authors would start moving away from the multidisciplinary megajournal and start returning to disciplinary-based publication. It would just take a few months to start seeing that trend.
We may be seeing the leading edge of that trend.
Based on an analysis of the first 500 PLOS ONE papers published in February 2014, the median number of days from submission to publication was 151 days (Interquartile Range (IRQ): 117 to 188 days), meaning about 5 months of delay with the middle half (25th to 75th percentile) of the papers being published within 4 to 6 months of submission. The main source of delay was the period from submission to acceptance–a median of 111 days (IRQ: 80 to 148), almost 4 months, while acceptance to publication took a median of 35 days (IRQ: 31 to 45). Editors please take notice of what you are competing against.
Is publication of the 2012 Impact Factor the likely cause of the decline?
The Journal Citation Report, which includes the annual Journal Impact Factor, was published on June 19, 2013. Based on their date of submission, 87% (435 of 500 papers) were submitted after PLOS ONE’s Impact Factor was announced. The median date of submission for this sample of articles was September 5, 2013. Even if it took a couple of weeks for news of the new Impact Factor to circulate, the majority of authors knew (or could have known) PLOS ONE’s new Impact Factor.
This simple explanation, that authors are moving to higher-performing journals, is not entirely supported by the data, however. Publication increased by 5% at the end of 2013, from 2904 in November to 3041 in December, but fell by 1% in January 2014 to 3019. Ultimately, we can never know what the trend would be if PLOS ONE’s Impact Factor stayed above 4, yet I’m at a loss to find other causes of the recent downward trend.
Authors are sensitive to Journal Impact Factors, and PLOS ONE authors are no different, as PLOS’s own analysis suggests. If the numbers reported reflect the bulk action of thousands of submitting scientists, the data suggest a mass movement away from PLOS ONE toward higher performing mid-tier journals. As the 2013 Impact Factor (due in June, 2014) is predicted to drop PLOS ONE even further [1], we may be witnessing the beginning of a very large shift in manuscript flow.
UPDATE: See PLOS ONE Output Falls 25 Percent for more recent data.
[1] James Hardcastle, Research Manager of the Taylor & Francis Group, predicts PLOS ONE’s 2013 Impact Factor will be between 3.1 and 3.2.


Discussion
59 Thoughts on "PLOS ONE Output Falls Following Impact Factor Decline"
I just wanted to quickly explain how I made this prediction. The estimated 3.1-3.2 range was created using citations matched at the article level in the Web of Science, the actual figure came out as 2.995. However this method normally under estimates Impact Factors as the Journal Citation Report uses a different and less stringent citing linking methodology. The same calculation for the 2012 IF (WoS estimate 3.559, JCR IF 3.730) underestimated the Impact Factor by 5%, by assuming the same error margin I created the range.
There is plenty of scope for PLOS ONE’s Impact Factor to fall outside this range and the size of the journal prevented me using the Cited Reference Search in Web of Science to create a more accurate prediction.
Have you looked at days from submission to acceptance by submission date? There were holidays at the end of the year of course, but maybe more conferences in between, winter depressions even.
Did new journals whose APCs are lower pop up in the meantime, maybe?
Did authors publish fewer papers?
I only reported what I analyzed. If you’d care to do your own analysis and report back through a comment, we’d all be interested in whether you found alternative explanations. The PLOS Article-Level Metrics site is: http://almreports.plos.org
I’m not sure I’ll be able to find evidence for any cause, Impact Factor or anything else, based on the ALM reports alone. And I’m not sure you could from just looking at (a possibly skewed sample of) PLOS ONE ALMs about published papers (did you check for changes in rejection rate?). Did you say this sudden decline in published articles in a certain month is a “trend”?
So far I found that the average number of days between submission and acceptance for articles submitted in September 2013 (1787 articles) is 87.6 (min = 5, median = 88, max = 155). I’d suggest to look at submission numbers before IF publication and after, check for trends in acceptance delay and check with the editors for changes in rejection rate and perhaps changes in the editorial team – before reporting that the only explanation one can think of is decline of the Impact Factor.
(Please don’t take this comment personal, I’m just unsure the method and data you used support the hypothesis that it’s the IF.)
The rapid growth of PLOS ONE also has a strong negative effect on its Impact Factor. For most journals the older papers tend be more highly cited and this is true for PLOS ONE as well.
As part of estimating the Impact Factor I also found these two figures:
2013 cites per 2012 article = 2.44
2013 cites per 2011 articles = 3.92
Using these citation rates had PLOS ONE published 14,000 article in 2012 rather than 23,500 then the estimated Impact Factor comes out around 3.4
There is one fairly obvious potential cause for this decline other than impact factor. PLOS ONE has competition. There are now over 20 mega-journals and the number seems to be growing daily. Recent new ones from the American Association for the Advancement of Science, Royal Society and the American Educational Research association were announced in the last few weeks. Some like BMJ Open and Scientific Reports have begun to really take off. Pete Binfield showed that while the growth of PLOS ONE has been tailing for about a year, when combined with other mega-journals, the total publications in this format has continued growing exponentially at least through last August (see: http://tinyurl.com/ozcwvvg).
Thanks David. Yes, these are all contributing causes, with the exception of competition form OA journals that do not yet exist–or didn’t exist–when authors were submitting their papers. Yet, I’m not reporting on a general decline, but a very abrupt change. And the only explanation that I have is that the Impact Factor is the cause.
Thanks for looking at this, Phil. I wonder how much the decline in research funding in the US and in other regions has impacted the overall number of papers published – would be good to compare this to a broader sample. It would also be interesting perhaps to look at the numbers by subject area – it would be informative to see how the PLOS ONE declines by subject area line up in terms of those traditionally most sensitve to impact factor changes.
Deanna, you make a number of good points. With regard to funding, given the variation in submission-to-publication delay, the effect would be much more gradual–not a sharp drop-off. Also, while US funding may be susceptible to declines, there have been large R&D funding increases in other countries (like China), which would serve to counter-balance the decline. In any case, I don’t have the data, so pin-pointing the contribution of each of the possible causes is not possible, although it doesn’t prevent us from speculating.
It should also be interesting to repeat this sort of analysis later in the year to see what sort of effect PLOS’ new data policy has on submissions.
The most interesting metric (at least for me) is that the average time from submission to acceptance for PLOS ONE is 4 months. This not particularly fast; in fact it’s very slow compared to many mid-tier journals that have submission-to-acceptance times of 1-2 months. Granted, PLOS ONE gets the article published a month after acceptance, but this is no better than many other journals that publish online ahead of print, usually within a month of acceptance. From my own experiences as an author and an editor, I believe that the time from acceptance to publication is less important to authors than the time from submission to acceptance. Authors want to know as soon as possible whether their manuscripts are accepted. In most cases, the date of acceptance is more critical than the actual date of publication, as the author can cite the paper as being in press for grant applications once the paper has been accepted for publication. Thus, speed of review and quick publication no longer seem to hold an advantage for PLOS ONE.
This has been the case for a while now. As PLOS ONE has grown, the issues of dealing with scale have slowed their review process. Here’s a post from 2011 noting much the same thing:
http://scholarlykitchen.sspnet.org/2011/10/07/is-plos-one-slowing-down/
The reason that PLOS ONE still has a speed advantage though, is its high acceptance rate. If you send in your paper, and it’s reasonably competent, it is going to be accepted. You know that you will not potentially have to go through a rejection and resubmission process at another journal. So even if the actual rate of the journal is at or just behind the rate for other journals, the net rate is faster because acceptance is nearly always assured for competent work.
The time from when a manuscript is received until to acceptance is only partially under control of the journal. Revisions are often required and as anyone who has been an editor knows, authors vary widely on how quickly they return (if ever) the revised manuscript. I think you need to be a little bit cautious when evaluating the time from a manuscript is received until accepted rather than received until first decision which PLOS ONE doesn’t appear to publish.
Another possible explanation that might account for part of this is….guess what? China! If word got out that publishing in PLOS One was not going to hold as much weight in considerations of promotion (or in scoring even a small monetary reward) as it may have previously, researchers would move away from submitting there en masse. One way or another, it would be interesting to see a breakdown of the countries of origin of submitted manuscripts, as well as any sort of breakdown by subject area, as previously noted.
Another reason could be that PLOS ONE’s decline in IF (and thus “prestige”) has stifled peer reviewers’ enthusiasm to review manuscripts for the journal. It has always baffled me how such a large journal can consistently attract and retain high-quality reviewers given its ever-increasing output of articles.
I agree. While the most prestigious journals can request (and receive) reviews within a week–some journals can push review even faster–an editor of a less-prestigious title may take several tries finding a reviewer willing to take on the job and may have to really push to get a prompt review. This is especially true for manuscripts that are not clearly written or are reporting confirmatory, negative, or ambiguous results. In more selective journals, the editor doesn’t even try to send these out for review.
Statistically speaking, I don’t think you have enough data points to determine a trend. Please repost in 6 months with updated data.
David, I’m focusing on a leading indicator and not a long-term trend. I think attempting to explain a recent drop based on a lagging event (Impact Factor publication) is entirely valid in this case.
Your chart may be good enough for discussion/speculation in a blog, but, if you submitted it to my journal, reviewers would eat you alive. There’s really only one significant downward point. And, this occurred shortly after the US Federal Government shutdown. Come back in a few months.
Real time observation, conjecture and discussion may be blogs biggest advantage over journals. Conjecture is the engine of scientific progress (as Popper pointed out).
Speaking of conjectures Ken, how do you see the 16 day US shutdown creating this abrupt PLoS downturn? I have a hard time imagining the mechanism.
Oh dear. You do realise that one down-turn is not evidence for a decline in submissions. You don’t seem to have done any statistical time series analysis on these data, just computed a few numbers and that ain’t statistics. There have been other periods where, from the graphi you show, the number of submissions fell relative to previous period/time point. Admittedly, this is on the face of it a larger fall in absolute terms than previous fluctuations, but as the response is a count variable, we might assume a larger variance at larger counts and as such the relatively large size of the “decrease” may be nothing important at all. That’s why we need statistics!
Similar arguments were made by those that sought to suggest the planet is not warming because of the so-called “pause” in NH average temperatures. Initially they interpreted a few low points as evidence for not just a pause but a decline in global temperatures and even did some flawed stats to show the trend was decreasing. It now appears these people were wrong and the physics of the climate system is better understood as a result, but things are not going to get cooler…
Come back in a few months or a year with a proper time series analysis and then you might have something real to back up or even validate your original prediction. (Which would, if true , be an interesting commentary on how scientists chose where to publish). The real issue with this piece here is that people (as evidenced by some of the comments) will try to “explain” the “result”, which may be nothing more than noise in a process that contains some element of stochasticity.
There is likely no single explanation for this. Changes in the publishing landscape are probably most important. But national factors also doubtless apply. For British scientists the census date for publications to be entered in their department’s submission to the Research Excellence Framework exercise (on which their funding will depend) was at the end of November. The upward trend in publication outputs in PLoS conforms nicely with the anxiety/urgency curve that was experienced by every Dean of Research in the Kingdom as that date got closer. Me included. Once we were past the end of spring 2013 t was increasingly unlikely that papers would be published by that date, and so submissions to PLoS and similar journals started to fall away.
Here’s another possibility that hasn’t been mentioned: maybe scholars are realizing that publishing in warehouse-journals such as PLOS ONE is not good for their careers both in the short- and long-terms. Publishing in more specialized journals may increase impact, and this will help with tenure, promotion, and long-term recognition.
First, I don’t appreciate calling PLOS ONE a “warehouse journal.” But labels aside, what you are describing would result in a gradual trend, which indeed is present in the data. I’m trying to explain a recent and dramatic decline.
I’m new to the term ‘warehouse journal’, and the interwebs is not useful. Can you explain? Why is it not appreciated?
For it not to be called a warehouse (and a messy one at that) at the very least PLOS ONE should learn how to categorize papers (much) better. In my area of work (chemical engineering), out of 11 papers now categorized, barely one or two are remotely related to the subject.
Does this sound like chemical engineering: “The Role of Gender in Scholarly Authorship”? This paper is also categorized in: Civil engineering, Electrical engineering, Graphs, Molecular biology, Parasite evolution, Sociology, and Welfare (social security). One (sociology) out of eight correct…
Were these papers even peer-reviewed by people of the right background? How were these areas assigned? The author affiliations are Biology, Environmental Studies and Sociology. Not so easy for a computer to spot the right answer, but pretty easy for an editor or copy-editor. What’s going on with this mockery reminiscent of the worst predatory journals?
I got a reply from Dr. Rachel Drysdale at PLOS ONE that I think is worth sharing:
“It sounds like the ‘Chemical engineering’ division of the PLOS thesaurus needs to be reviewed. A first assessment tells me that it is the rules for the application of the term ‘Chemical engineering’ that are at fault.
Also I see ‘Chemical engineering’ only has two narrower terms – ‘Chemical production’ and ‘Industrial chemicals’. That could bear improvement.
(…)
We have a large thesaurus and only slightly more than one person working on it, so all pointers gratefully received.”
I am glad to hear they are at least aware of the problem, and trying to fix it with what sounds like a limited budget.
Tagging articles incorrectly does not sound like a thesaurus content problem, more like misusing the thesaurus. But the thesaurus sounds interesting. Is there a link to it? Given PLoS’s vast size and scope it desperately needs strong discovery tools, which includes accurate tagging. Having over 5000 editors do hand tagging may be the problem. Perhaps they do not take the tagging seriously.
Here’s a link Rachel provided me on how they are assigning subject areas:
http://www.plosone.org/static/help;jsessionid=03ED4C694947B7D204CF413FEDC01B59#subjectAreas
It sounds like the problem is with it being, as of yet, an imperfect automated procedure.
Ooh, now we are in my domain. The semantic and taxonomic structure of science and all that good gorp. I will look at this with great interest but its failure does not surprise me. Thanks RMS. Here is some of my stuff on the DOE OSTI hybrid taxonomy and thesaurus (http://www.osti.gov/taxonomy/), which is probably one of the world’s most complex semantic systems: http://nkos.slis.kent.edu/2008workshop/DavidWojick.ppt. But I fear we are digressing from the thread.
It seems from RMS’s link that PLoS One is using a rule-based expert system to try to assign subject area categories in their thesaurus to each article they publish. It is also used in their search system, but it looks like it may not work all that well. It is a hairy problem. For those not familiar with this kind of thesaurus it is actually a semantic taxonomy, not a book of synonyms.
This is an interesting article and the comments it’s bred have been interesting to read. But your first paragraph preamble about the size of the sample population makes it sound as though statistically this drop can’t mean anything but a decline. If you were to take the graph you posted and generate a fitting curve to the data with a confidence interval (instead of a direct line) I wager this drop falls well within the bounds of predictable variability for this data set.
Be careful when you cherry pick using good statistics and bad statistics. These are the same conclusions being fought on the fronts of global “warming” and economic prediction battlefields the world over. Take the opportunity here to reinforce good statistical considerations of data, rather than glossing over them to reinforce a speculative point.
And gosh, if that drop is outside the lifetime confidence interval for the journal, that really would be something.
Hi Justin. You’re not the first to make a comparison from publication output to global warming. Confidence intervals would be appropriate if we are trying to estimate an underlying process–a longterm trend like global warming. However, I’m considering this to be reporting on a natural experiment: At a certain point in time, an important indicator (the Impact Factor) was published. We know, that authors are sensitive to Impact Factor and that authors will base submission decisions, in part, on the Impact Factor. It seems very likely to expect a decline in publication given the delay from submission to publication. I’m not doubting that there are other underlying processes involved in explaining publication numbers. I just don’t deal with those in this post.
Phil, you’re certainly correct in so far as observing the natural experiment. I wouldn’t deny you the capacity to speculate. This has been done in economics for years. The daily price point of a highfalutin market new-comer jigs and speculative investing goes ape. But your preamble appears to be an attempt to suggest this dip is a statistical certainty of decline. What I take issue with specifically is:
“…stochastic events tend to dampen themselves out…PLOS ONE is playing a very large numbers game, so a sizable decline in published papers signals a structural shift and not a random blip.”
You’re flirting here with a deeper concept in statistics, one that skirts between technical and functional certainty. The large number of submissions to PLOS ONE represents a widening sample space, thus increasing technical certainty. Things like submission deadlines, errors in the pipeline, all your examples – those certainly carry less weight. However, the intrinsic nature of publication ebb and flow is not accounted for, and could only be accounted for if every article ever published went to PLOS.
So in an attempt to get at functional certainty you can do two things. Calculate the trend and confidence interval of PLOS publication record and ask “is this dip outside that interval”. If it is, the follow up question is to ask “Has the publication output of the field increased or remained steady in that time window?” This data would help you determine if the drop at PLOS is due to intrinsic or extrinsic factors, such as a global change in the sample field.
While I understand this article isn’t meant to be make any definitive claims, I take issue with hand-waving statistical concepts to make a point. What you’ve stated sounds logical to almost anyone, including most scientists, but is in fact a misrepresentation of basic statistical principles. I fear that every time someone ingests these misrepresentations in to their understanding of the topic it makes it that much harder for people trying to use statistics the right way to make accurate points about data. That’s all.
I wonder if it’s possible to firm up (or indeed remove) a link between impact factor release in June of one year to publications in the following January/February by looking back a few years. A very quick look at your graph shows a big increase in number of publications around the beginning of 2012 a slightly smaller one in 2011. There’s nothing to see other than the general upward trend at the beginning of 2010 – but if I’m looking at this right in the JCR, then there was no IF to release in the previous June.
Several people have mentioned confidence intervals (in a seemingly critical way). I thought confidence intervals were part of sampling theory, probabilisticly relating sample values to population values. But there is no sampling going on in this case. What am I missing?
All very fascinating – but you are counting angels of the head of a pin here when you build this house of cards on anything to do with Impact Factor [sic]. There are dozens of excellent articles available that thoughly trash any notion of intrinsic value, or of statistical validity, being associated with Impact Factor (IF). (Remember, apart from many other concerns, IF is an arithmetic mean value being used to ‘characterise’ the highly skewed, non-normal distribution found in the citation pattern of any journal). Quite why IF has acquired a place in the thinking of supposedly numerate branches of science and medicine is a paradox in itself. Making the present study, posited on whether PLOS authors *might* be finessing their publishing decisions on fluctuations in this deeply flawed pseudo-metric, is stacking the absurd rather deep!
The time of all your statistically savvy correspondents would be better used to help bring down IF, root and branch. This is no sideshow. The abuse of this absurd pseudo-metric by appointment, promotion and funding committees is poisoning the lives and careers of many excellent workers. Don’t give IF any more oxygen. Creating a robust metric of publication quality presents a challenge – IF isn’t a metric of anything.
Personally I like the IF, despite its well known shortcomings. No metric is perfect and you are wildly overstating the case against the IF. Moreover, and more importantly, the IF has great the power that you decry so Phil’s analysis is important. When analyzing people’s behavior based on their beliefs one has to use their actual beliefs, not the beliefs you wish they had.
David P, I’m sorry I can’t accept that point. It’s not a question of IF merely having ‘shortcomings’. IF so grossly misrepresents the situation for the individual papers within a journal and the journal itself that it cannot be given any further credence. It’s just not satisfactory to suggest ‘it’s a bit rough and ready, it’s the best we’ve got etc etc’. If the pseudometric is so abberant, it must be abandoned. Yes, many people clearly do have ‘actual beliefs’ about IF, but as those beliefs are patently ill-founded that is where the intellectual discourse should be directed.
Whilst there are many lines of well substantiated criticism of IF, I reiterate that the fundamental and fatal flaw in IF (as flagged by all its critics) is readily recognised. The citation pattern for papers across a given journal is (in every case studied) highly skewed and thus non-Normal. Such a distribution cannot be characterised by its arithmetic average. This criticism holds all the way from Nature and Science to JBSPS (the Journal of Boring Stuff in my Particular Specialism). (A recent summary of the problems inherent in IF was made by Miller, D (2013). Why does Impact Factor still have impact? Physiology News 93, 12–14; http://www.physoc.org/magazine).
Against that background, the present discussion of details of PLOS’s IF and author’s publication tactics seems an arcane development. The later discussion had even moved on to consider ‘confidence intervals’ – hmmmm!
I do not agree that impact factor is a flawed metric. It does precisely what it says it does. It is an evaluation of a journal, not of an article, and the fact that IFs pretty much remain steady means that they do in fact predict the quality of a journal. IF is a good tool for tenure committees as it demonstrates that other specialists in the field have looked favorably on an author. What IF is not and cannot be is an evaluation of a particular article. But why would anyone want that???? You could just read the article.
I would describe it as “flawed” for the following reasons:
Speed: IF, and citation in general, is a slow metric. When we look at the current IF for a journal, we’re looking at where the journal was 2 years ago, not where it is now.
Limited span: IF only covers 2 years of citations for each article. Some important articles aren’t recognized for many years, and some fields move at a much slower pace.
Review articles: Review articles are favored over articles presenting original results, because everyone needs a review article to cite in an article introduction. The top spots in most categories are dominated by review journals rather than journals publishing original research results.
Influence of a small number of articles: one or two really well cited articles can greatly alter a journal’s IF. Acta Crystallographica Section A had one article that was cited 6000 times. It went from an IF of 2.051 to an IF of 49.926. The second most cited article was cited 28 times. After 2 years, this article stopped counting and the journal dropped back to 2. Did the journal suddenly become 25X more impactful for those 2 years, and 25X less impactful thereafter?
Different fields publish in different volumes and have different citation practices, making it difficult to compare IF’s between different categories.
The IF offers a false level of accuracy, going out three digits beyond the decimal point. Is a journal with an IF of 4.002 really any better than a journal with an IF of 4.001?
All that said, it’s still a pretty good metric if applied properly to look at what it’s meant to measure, and every other metric I’ve seen has its own set of flaws. When we use a metric, we must understand what it measures and be aware of its shortcomings.
Can’t agree, David. You are asking IF to do what it does not claim to do–though others claim it does all those things, and they are wrong. The relatively stability of the IF for a particular journal is the proof of this. Now, if we want to measure other things, heaven knows there are better ways. The problem with IF is that it is a small idea that managed to fill a large vacuum.
I don’t know, I don’t think I’m asking for anything outside of what the IF is supposed to do, as Thomson Reuters puts it, to measure the “citation influence” of a journal. Each of the things I’ve listed above are examples of flaws in how well it reaches that specific goal. The IF gives a view of citation influence that is already out of date by the time it’s reported, may miss the influence of slow developing articles in slow moving fields, falsely favors the influence of review articles over original research, measures citation influence in a way that can’t be compared from field to field and offers a false level of accuracy in measuring citation influence. How is that asking it to do anything other than measure citation influence, or at least measure it better than it does?
I’m not saying that as a metric it lacks all value, but it is not “practically perfect in every way” (bonus points for those who can guess what movie I saw this weekend).
Stability tells you very little about how well a metric is measuring what it claims to measure, just that it is consistent and that the factors it measures remain fairly regular over time. If we measured journal influence by page count I suspect that for most journals, the number produced would remain relatively stable as well.
But we are in general agreement that the big flaws here don’t lie within the IF, but within how badly it’s taken out of context and used where it shouldn’t be used.
The world is full of rough measures being used to make serious decisions, from test scores to using tree rings to estimate temperature. The only solution is better measures. Nor would I assume that the people using the IF are unaware of it’s shortcomings. A basic rule of reasoning is to use what you have until something better comes along.
I think what this analysis shows us is how little influence publishers have over this matter. PLOS has been working tirelessly to distance their journals from the Impact Factor, going so far as to create a suite of article level metrics they suggest one use instead, and regularly editorializing against the Impact Factor. Yet even with all of this, submissions to their flagship journal appear to remain heavily influences by the Impact Factor (further evidence here http://scholarlykitchen.sspnet.org/2013/07/30/the-persistent-lure-of-the-impact-factor-even-for-plos-one/).
In my opinion, publishers shouldn’t try to dictate to the research community–we are a service industry and our job is to meet the needs of researchers. I’m sure you don’t want the Elseviers of the world dictating to your institution and your funders how they should hire, promote and fund researchers. That’s something the academic community must decide for itself and enforce itself. Publishers are in a secondary position here and will follow the lead set by their customers, just as they now focus on Impact Factor because researchers have told them that’s what is important.
Publishers are an easy target for academics on this subject–it’s easier to blame someone else than it is to look in the mirror. Editorials about the evils of publishers and their “luxury” or “glamor” journals make for great copy and an entertaining rant, but those things only exist because academic institutions and researchers have created and continue to support a system that encourages them.
I suspect that most publishers would agree with you, that the Impact Factor is a flawed metric which is mis-used in contexts where it’s irrelevant. But even when a publisher takes as strong a position as PLOS, there’s still a disconnect that is shown by this analysis. Understanding what is really going on is an important step toward progress.
I’m incredulous that several of you above are still maintaining that Imact Factor has *any* virtues that justify the attention it is given by the publishing authors, by the journal editorial boards and their publishers, by selection, promotion, tenure and funding boards, as well as by commentary articles such as the one triggering the present thread.
I recommend reading a most compelling case, one that covers all the present audiences for this pseudometric. It is the San Francisco Declaration on Research Assessment (see http://am.ascb.org/dora/). For those with more statistical knowledge and interests, you could check e.g. Vanclay, JK (2012, at http://arxiv.org/pdf/1201.3076v1.pdf). A recent paper by Brembs et al (2013) provides a thorough, wide-ranging and further IF-damning analysis of a range of aspects of the perception of journal rank on publication behaviour (http://journal.frontiersin.org/Journal/10.3389/fnhum.2013.00291/full). Time for some homework.
IF is an evaluation of the editorial practices of journals. That’s all it is. Your objections are to the uses, many ill-advised, that IF is put to. This is like banning brooms because someone hit you over the head with one. They were designed to sweep the floor, and no more. And for that purpose they do a serviceable job.
I think you’ve misunderstood the responses here. Everyone responding is well aware of DORA, and we’ve written about it in these pages (http://scholarlykitchen.sspnet.org/2013/05/21/impact-crater-does-dora-need-to-attack-the-impact-factor-to-reform-how-the-it-is-used-in-academia/).
I can’t see any of the responses to your original statement that suggest that the misuses of the Impact Factor are justified. However, if one knows the history of the Impact Factor, how and why it was developed, one can likely appreciate it if it is applied properly, with an understanding of its limitations. Like most issues, the extreme view chooses to oversimplify a complex situation into black and white issues, where the real world exists in shades of grey.
Several of the comments have indeed suggested the authors do see merit in Impact Factor. In your own remark this is implied since you talk of ‘understanding its limitations’ and ‘if it applied properly’. Immediately above, Joseph Esposito regards it as [only] ‘an evaluation of editorial practices’, implying that it has validity there. These remarks essentially espouse the view that IF is the ‘best we have’, even if ‘rough and ready’ etc, as I mentioned much earlier in this thread. But indeed, as David Crotty remarks, I am being ‘black and white’ about this issue because, in assessing IF, I maintain that is a valid position. It’s not just a question whether IF is being misused or deployed out of context, as suggested by David, Joseph and several others, but whether it is capable of being appropriately applied in *any* context?
At risk of boring (and probably annoying) contributors to this thread, there has been no answer to a widely made criticism of Impact Factor that I repeated earlier: IF represents what is generally a skewed, non-Normal distribution of citation rates (of all the papers in a given journal over a given time) by their arithmetic average. This is simply an illiterate application of statistics, hence my reference to IF as a pseudometric. At risk of ‘teaching my grandma to suck eggs’ here, it seems necessary to spell out what exactly is so damning about IF’s intrinsic nature. In other words, why is an ‘average’ such a bad thing? It should be obvious that the ‘character’ of a journal is signficantly different between one where a great majority of the papers are cited to a similar, but modest extent and one where just a few papers are very heavily cited with the rest rarely cited at all. Yet both journals can have the same IF … even to three (in)significant figures. There is an infinite variety of very different citation patterns between these two ‘extremes’. The IF quotients might even remain pretty stable over time even if these underlying citation ‘profiles’ change. It should be obvious that very different conclusions need to be drawn about everything to do with these journals, but that Impact Factor, as crude average, can provide no relevant information. That’s why it is statistically illiterate to attempt to do so. But things are worse still: Impact Factor provides very misleading information since we have no means of detecting the profound differences amongst the citation patterns from it. It is apparent from this one detail that we can learn nothing about a journal, nor any individual papers that appear in it, or that might be submitted to it, nor about the authors, if we seek information from Impact Factor.
This is just one element in a comprehensive critique of Impact Factor. Yet, I contend, this point alone is a logical killer argument. I have noted elsewhere that if one reported the definition of an experimental metric analogous to Impact Factor in the Methods section of a scientific paper, the referees would obviously have to trash it. Yet we see IF continues to be actively and intelligently discussed by essentially the same audience without IF having an informative leg to stand on. So, Impact Factor is a sociological puzzle (why *do* people continue to use it?), yet it is alive in the real world (clearly people *do* continue to use it): for that alone it merits discussion. I can only ask those who believe that IF has value, in whatever context, to explain and justify precisely what that is.
Again, I think you’re misinterpreting the comments here (along with stating the obvious). We do understand how averages work, and if you read my comment above (http://scholarlykitchen.sspnet.org/2014/03/07/plos-one-output-falls-following-impact-factor-decline/#comment-136089) you’ll note that I pointed out pretty much the same flaws you discuss here (along with several others).
Where you are wrong is in implying that we are saying that authors should see merit in mis-using the Impact Factor, rather than what we are actually saying, which is that despite all of the well-traveled criticisms and work done to reduce its use, authors still continue to chase the Impact Factor. This is an observation of reality, not a statement of support.
That said, even a flawed metric can have merit and provide some information, if used properly. Knowing the average of the heights of people in a room doesn’t tell you anything about the height of an individual in that room, but it does tell you something.
Yes, fine. I gave a pre-apology for the egg-sucking. And of course I acknowledge(d) that the use of Impact Factor seems to be a sociological reality in publishing science and medicine. However, I think that a detached reading of much of this thread would fail to elucidate that, if Phil Davis’ thesis about PLOS is correct, it is an ‘Emperor’s Clothes’ phenomenon that is powerfully at work. If indeed PLOS One authors are being swayed in their submission/publication strategems by Impact Factor, the story needs to address that bigger picture. If the conclusions are correct, then authors are chasing, or allowing themselve to be chased by, an illusion. This aspect is entirely missing.
But I must nit-pick a moment longer in your last post, David: what exactly *do* you think “the average height of the people in a room” tells you? Statisticians will be very interested. If that average is to “tell you something” I’m sure you will need to have run through the thinking that, if the sample is of a known size, perhaps knowing that they’re all adults from a known population etc etc, that with some degree of (statistical) confidence you could indeed properly draw some conclusions and thus ‘be told’ something. But you would be off to a great start since you would know, a priori, that you were dealing with a variable that is normal distributed in humans§. (If there were just two people in the room – assuming you at least knew *that* – you could also get somewhere!). I come back to the point that, knowing what we do about journal citation patterns, Impact Factor cannot “tell you something” at all.
You are still talking of authors “mis-using” Impact Factor, whereas we should simply be saying (again, provided Phil Davis is right) that they are ‘using’ it (and that that use is the problem). So once again, what are you suggesting *would* be proper use of Impact Factor?
(§§ I have to note, for accuracy, that there are even *some* qualifications to that assumption of normality!)
Uch, please don’t ask me to defend the Impact Factor. Really, it’s something I pay attention to because academic researchers and their institutions pay it so much attention. My job is to see that their needs are met, and if they focus on the Impact Factor, so must I. I also think it’s unfair to ask the author of this piece to write about a specific interpretation of his analysis. He’s written what he could draw from the numbers, and chose not to editorialize. The joy of the internet is that others are free to do so, even as you have done in the comments here.
That said, if I’m looking to install a shelf in a room, I have to start somewhere. Ideally I’d have perfect knowledge of every single person who might ever use that room, their height, the length of their arms, etc. But in the absence of that data, any information I can gather would be helpful. Knowing the average height of those who use the room would at least give me some sort of ballpark for knowing how high to hang the shelf. Again, imperfect, but in a vacuum, better than nothing.
The stability of the IF for a particular journal is the evidence that IF does exactly what it says it does. The complaints about IF are for things that IF does not purport to do. It says NOTHING about a particular article.
Joseph – I’m sorry if this seems dense of me, but what do you think “IF does” or “purports to do”? I’ve made a case (merely echoing that better made by many others) that IF is intrinsically incapable of ‘doing anything’ because it is statistically invalid. A single number (such as an average) can be useful when it is a valid representation of a population (of data) under pre-defined conditions (of distribution), but only then. I would agree that even a statistically valid average doesn’t tell us anything about an individual datum (article) either – we would need to know (at least) the Standard Deviation of the population too. But Impact Factor cannot offer this – it cannot “do” this. That’s why it is just a number that lacks information value or, as I suggest, delivers disinformation value.
As I just outlined in my response to David Crotty, the stability (or otherwise) of IF, given its statistically invalid status, also tells you nothing. In other words, if IF either changes or stays the same, it would be pointless to try to interpret what that might mean (about the underlying citation pattern of the articles in the journal); isn’t that self evident?
Your use of the term “self-evident” borders on an insult. I will therefore drop off this thread after this comment.
What IF does is measure the average number of citations to the articles in a particular journal over a specified period of time. That’s what it does.
I am not a fan of IF–or any other metric. This compulsive quantification is misplaced. Judgment matters.
DRCaffeine, sorry but you have in no way shown that the IF is statistically invalid. In fact most of your complaints are true of all averages, many of which are quite useful. Your criticisms are well known so if people continue to use the IF they consider them inadequate. That is the explanation.
David W – I had hoped my explanation of IF’s statistical invalidity was clear enough. Allow me one more push? An average will useful ‘describe’ a data set if, and only if, the distribution of the data is known. For most practical purposes, a Normal distribution is required. (Indeed, a ‘reporter’s’ deployment of an average thereby lulls, or entices, the ‘reader’ into assuming – not unreasonably – that the underlying distribution has to have been Normal). If one is properly fussy, tests of normality are applied to check that deploying a parametric statistic (such as the average) is appropriate. So, first of all, my complaint is patently not “true of all averages” (as you claim). It is only true of crude averages where the basic requirements for that statistic cannot been applied. IF is the case in point.
Now consider further the specific case you had mentioned (in support of IF), the stability of IF (from year to year). If the distribution (in this case of citation rates of individual articles in a journal) is a Normal one, then the stability of the average indeed *would* indicate that nothing much has changed. That is exactly what you have concluded. (OK – there is a *possible* change in the *range* of citation rates which, provided it remains symmetrical and Normal, would yield the same average, albeit with a different Standard Deviation, if one were quoted). However, I’m advising you that you can’t conclude any such thing just because Impact Factor remains constant. As I noted earlier, because article citations are not Normally distributed, the pattern (of citations per paper) could shift in very fundamental ways and yet still yield the same IF. Indeed, one of the worst scenarios might be that ‘typical’ papers became more highly cited whilst the small number with very high citation rates falls back. This could lead to IF falling, even though the ‘average’ (meaning here ‘typical’ or ‘most common’) papers are mostly being more highly cited. Many permutations of such changes of citation rate distribution are possible, plausibly leaving IF, up, down or unchanged. The underlying changed citation ‘patterns’ are not detected or reported by IF. This is why the crude average defining IF is statistically invalid, and thus not ‘allowed’.
But your final point, and one that I addressed earlier too, is that clearly people continue to use the perishing numbers! The only plausible explanation is that they haven’t fully grasped the reality of the situation. I do hope that the argument above has helped you to grasp the flaw in your confidence in one ‘test’ of IF – it’s relative stablity year-on-year (for certain journals).
I have mis-attributed Joseph Esposito’s last substantive remarks to David Wojick in my response immediately above (about the stability of IF): my apology for that mistake is freely offered to both parties. However, I have only now noted that Joseph E found my use of the phrase ‘self evident’, one standardly employed within argument proofs, to be “bordering on an insult”. Nothing of the sort was intended or expected. I genuinely assumed the conclusion to be ‘self evident’. In the event, I did rehearse the point more fully just above. I contend that I have only argued from clearly stated principles on my part and requested that specific phrases used by those arguing a different perspective be clarified.
I repeatedly asked how the term ‘average’ can fairly describe the Impact Factor, in the context of citation of scientific papers, to mean something other than what practising scientists routinely take the word to mean. (There’s no doubt that IF poses as a metric relevant to journal citation patterns: if so, the rules of statistics apply. I would cite in support, for example, David Colquhoun (2003) Nature, vol423, p479). Then Joseph accuses me of “compulsive quantification”. That’s precisely what I am complaining about. What is the Impact Factor if not that? Consequently, I can very much support Joseph’s last remark; his appeal for judgement. That’s what is needed in assessing the citation pattern of journals as well as of individual papers. My central point remains that the use of IF, like any conceivable single-number index, can only hinder such judgement.