Editor’s Note: This posting is by Elisabeth Jones, a Postdoc/Lecturer at the University of Washington Information School and a Research Associate at the University of Michigan Libraries. Her research explores the social, political, and institutional issues that arise alongside changing modes of information access in the digital world.
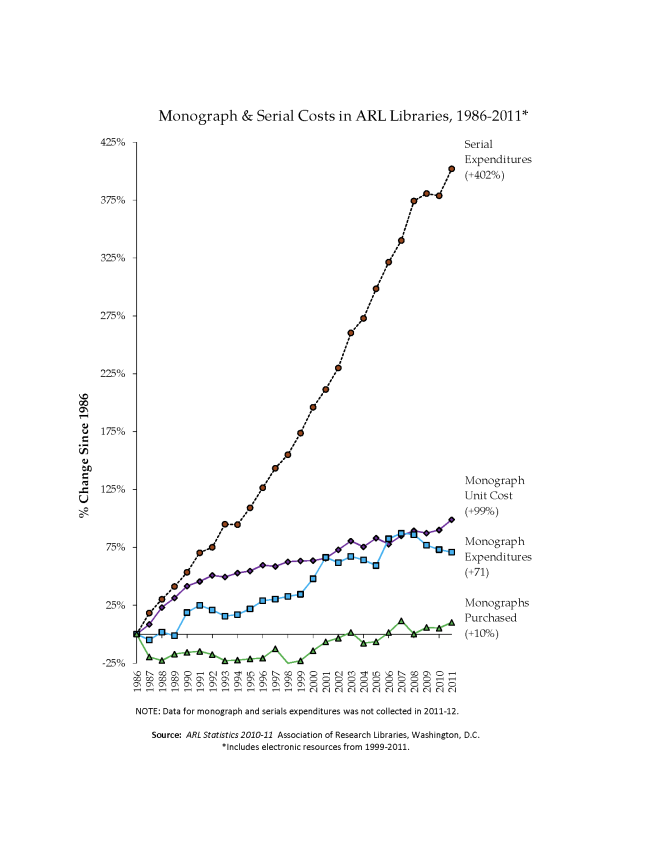
A recent post by Kent Anderson on The Scholarly Kitchen described the ease with which a bit of misinformation can blow up into an “academic urban legend” through the magic of citation networks. While Anderson’s tale centered on the iron content of spinach, the phenomenon of misinformation creeping into the conventional wisdom is hardly limited to the field of nutritional science. In fact, those of us interested in the future of publishing and libraries fall into these patterns ourselves. As in other domains, some of the data we rely upon as well-established and unquestionable sometimes turns out to be quite questionable indeed. This post will describe – and begin to question – one such touchstone within our field: the Association of Research Libraries’ (ARL’s) annual graph, “Monograph and Serials Costs in ARL Libraries.” The most recent version of the graph appears below:
What’s wrong with this picture?
Every year for the past three decades, ARL has released a set of statistics about its member institutions – everything from the number of graduate students at their home universities to the average prices of the monographs they purchase. Since its addition in 1989, one of the most frequently-cited pieces of this annual report has been that year’s version of the graph pictured above. It is especially common to see elements of this graph, or even the graph itself, referenced in discussions of the economic issues surrounding electronic serials subscriptions, analyses of the perils facing library collection budgets, and arguments in favor of open access publishing – indeed, it has been used that way previously on this very blog – and a quick search for the exact title of the graph (sans date range) in Google Scholar pulls up nearly 100 hits.
So well-established is this image, in fact, that one article on library collection development trends [paywall] goes so far as to assert that it “is quite possibly the best-known contemporary symbol of today’s library in today’s marketplace.” At present, ARL is undergoing a significant reorientation of its data tracking practices in this area, so it is unclear whether further revisions of this graph will be produced. However, it is quite unlikely that the many versions already out there will cease to be used in analyses of the library and publishing world – although, as I will suggest, perhaps they should be. (Stay tuned.)
Recent versions of the graph have reported on four trends relevant to materials purchasing in major research libraries (the members of ARL):
1. Serial Expenditures,
2. Monograph Unit Cost,
3. Monograph Expenditures, and
4. Monographs Purchased.
The data here come from surveys of ARL member libraries, conducted annually by ARL itself. And on its face, the trends that the graph portrays seem very reasonable. They tell a familiar story, in line with the conventional wisdom: serials expenditures are skyrocketing, while all the figures for monographs meander along well below. And this familiar story, backed up repeatedly by this exact graph and its direct predecessors, has been used to make countless numbers of policy arguments at levels ranging from the departmental to the international.
There is just one problem with this graph – and by extension, our community’s (over)reliance upon it: the trends it portrays cannot logically coexist.
Setting aside the Serials trend line for a moment, let’s take a closer look at the three lines for monographs, and particularly, for the sake of illustration, the trends these lines portray in the period from 2008 to 2011. In that period, we can observe the following:
– Monograph Unit Costs are Rising
– Monographs Purchased are Rising
– Monograph Expenditures are…Falling?
This is plainly impossible. Say the average cost of a book rises from $50 to $60 over the same period where the average number of monographs libraries purchase rises from 20,000 to 25,000. Basic arithmetic tells us that the monograph expenditures must also rise, from $1 million to $1.5 million ($50 * 20,000 = $1,000,000; $60 * 25,000 = $1,500,000). There is – or ought to be – a precise arithmetic relationship among these values. And yet the canonical ARL graph shows expenditures falling while prices and purchasing both rise.
How can this be?
The answer to this question reveals a deep and potentially fatal weakness in the methodology behind the graph. The problem is that all of the trend lines it portrays are derived from different samples that are of different sizes. For the most recent version of the graph, the Monograph Unit Cost figure represents the median of 57 libraries’ data, the Monograph Expenditures figure represents the median of 97 libraries’ data, and the Monographs Purchased figure represents the median of 58 libraries’ data (as shown in the Excel file ARL provides alongside the graph).
This is not good statistical practice; indeed, it renders the trends in the graph completely non-comparable.
Yet, it is easy to see how this might have happened. One suspects that the story runs something like this: All of ARL’s survey data for each year is initially aggregated by variable, and is initially analyzed in isolation. At some point, someone has the idea to extend this analysis of each isolated variable longitudinally, comparing the variables’ values to past values of those same variables. But to make sure that the data is comparable year-over-year, they limit the sample to the libraries with complete data for the period, within each variable. So far, so good.
However, different libraries have answered – or have abstained from answering – different questions. Thus, when the variables get aggregated into a cross-variable comparative graph, the samples ought to have been re-adjusted, to ensure that the sample data was not only complete and comparable along one dimension (each variable over time), but along all of those relevant to analysis – including, and especially, comparability of the population of libraries for each variable. But this does not seem to have been done.
Additionally, it will come as no surprise to readers of The Scholarly Kitchen that the way in which libraries define the term “monograph” has been evolving. Where in past decades it could be more or less depended upon to refer exclusively to bound paper books, in recent years more and more libraries have been reporting ebook statistics to ARL under this same heading. Yet, this evolution has not occurred uniformly across ARL members, and that has caused further problems with the organization’s statistics. Indeed, as ARL’s Martha Kyrillidou recently noted to me via email, ARL no longer tracks “monographs,” per se, but asks its members about “one time purchases” instead.
A bit more digging into the ARL archives, moreover, reveals a further wrinkle: the logically incompatible trends portrayed in the graph have only appeared in iterations published since 1999; previous iterations appear at least superficially logical in their trends. And indeed, on page 5 of the 1993-1994 edition, explicit mention is made of the sampling issue, and how it has been dealt with: “The graphs are based on time series that start in 1986, and they depict only those libraries that have had no missing data in the respective variables since 1986. Although these graphs are based on less than the full population of 108 academic libraries, additional analysis has been carried out to ensure that the time series trends represent population trends.” Based on the inconsistencies enumerated above, however, it would appear that these procedures may no longer be followed.
ARL is one of very few organizations that collect this sort of broad-scale longitudinal data on libraries’ behavior and environment – and taken in their full context and with the requisite grains of salt, these data are exceedingly valuable resources for thinking about the present and future of both academic libraries and scholarly publishing. Yet, in the case of ARL’s “Monograph and Serial Costs” graph, this necessary context seems to have fallen away: the evolving image has become increasingly entrenched as unquestioned truth, even as the trends it portrays have diverged further and further from what is logically possible. The effort to ground arguments for open access, for changes to library practice, and for new forms of scholarly publishing in empirical data is undoubtedly positive. However, as we go about assembling data for these purposes, we must continue to look upon it with a critical eye – no matter how stable and objective the source may appear.

Discussion
10 Thoughts on "Guest Post: Elisabeth Jones on Monograph Costs and Urban Legends–What's Wrong with This Picture?"
Good posting and an example where poor data interpretation that can lead to poor policy choices. It must be a nightmare to gather decent and reliable data, though. Since early 2000s many book publishers sold bundles of books as part of subscription services – how are these counted? And then there are titles that were ‘one-time purchases’ and are now serials – at OECD we’ve re-positioned around 50 annual titles as serials and I’m sure we’re not the only publisher to have done so.
Indeed Toby, using simple statistics to reason about complex, evolving systems is one of the fundamental problems in policy making. Especially when advocacy tends to amplify misinterpretation. This fallacy is everywhere in the policy debates.
In this case I think the serials line is also misleading. My understanding is that the per article cost has risen much more slowly, perhaps at the rate of inflation, or even less. If so then a lot of what we are seeing is actually the growth of science, not the cost of a fixed entity.
There are many other comparisons that stakeholders might find interesting: for example, library spending on materials as a proportion of total spending at universities (getting smaller, I bet); library spending against the number of students and faculty (less per head?); library spending by publisher/vendor (love to know how much goes to the big boys); downloads per dollar spent (bet this is rising) … the list is long.
Some of your list has been presented and/or discussed here during prior posts. (Unfortunately we cannot search on the comments, just the articles.) However, getting good data in a highly distributed system like scholarly publishing is laborious and expensive, if it can be done at all. The list of what is practical may be short.
As one who has cited this graph often, I feel both enlightened and chastened–though I am relieved to see that the graph was more statistically reliable in versions before 1999, when i was citing it most often.
One other question that occurs to me: what was up with monograph purchase rates in 1986?
1986 seems to have been a bumper year – more monographs were bought then than any year until 2003 – but it’s immediately followed by a crash of 20% or so and then monograph purchase rates are more or less constant from 1987 through to the end of the 1990s, when they start climbing again…
It’s a little hard to say, since we can’t see from this graph what the data were before 1986, but…one bit of speculation: if that part of the graph is to be believed, monograph prices rose a lot in the years just after 1986. Purchasing did decline, but expenditures stayed flat because the prices went up, right? That actually seems pretty sensible to me.
That said, it would not surprise me at all to find that the reason that the data behind this graph began to be collected was that some of these trends were already starting to manifest prior to 1986 – so that may not have been a bumper year, but rather a mid-point in a longer downward trend (as far as titles purchased).
Doesn’t anyone remember the NSF-funded study by Bernard Fry and Herbert White published in 1975 that found, for the period 1969-1973, that the ratio of book to journal expenditures in the largest academic libraries had dropped over that five-year period from better than 2 to 1 to 1.16 to 1 (Fry/White 1975: 61), with every expectation that this trend would only get worse–as, indeed, it did. Fry and White’s prognosis for university presses was particularly gloomy: their situation, they said, “can be described, without exaggeration, as disastrous. Already heavily encumbered by operating deficits…, university presses appear…to be sliding even more rapidly toward financial imbalance” (Fry/White 1975: 11).