At this year’s Professional and Scholarly Publishing (PSP) meeting in Washington, DC, a panel of publishers from AAAS, ACS, and Wiley, with a moderator from Silverchair who works across many publishers, discussed the subscription model and its future. Overall, the group thought the model was still preferred for selective journals, that Gold OA journals are competing but not making much headway in the market (16-18% of papers and 3-6% of revenues after 15+ years on the market), and that given the increasing volume of science being published, maybe the “crisis” facing subscription journals isn’t a pricing crisis as much as a funding crisis, a point librarians and publishers might benefit from viewing as common ground.

So, how is the subscription model doing on a broad scale? It’s hard to know. At a separate session on metrics at PSP, the question of where usage fits into discussions of impact and alt-metrics raised the issue that usage stats are generally carefully guarded and only shared on a business-to-business basis. What wasn’t said is that usage statistics are also very hard for both publishers and libraries to manage effectively, and that often both parties are a bit in the dark.
The overall trends indicate that demand for subscription journals continues to grow.
These sessions made me wonder about what trends we might find looking across the aggregated usage data we host for a few dozen publishers, covering more than 1,500 journals. While only a small slice of the overall market, these publishers come from all over the world, cover most disciplines, and include commercial, non-profit, and university press publishers. It’s a fairly representative microcosm, large enough to aggregate for useful signals. In addition, these publishers serve over 7,000 institutions and corporations buying scholarly content, so the “buy side” of the market is also pretty well represented.
So, we ran a few high-level queries, and here’s what we found.
- Most institutions are seeing their usage steady or increasing, with usage increases occurring most commonly. Among the thousands of institutions included in the dataset, 38% experienced increased usage during 2016, while usage held steady for 33% (less than 5% change in either direction), and decreased for 29% of the group. This suggests that subscription usage is still popular, with 71% of subscribing institutions seeing either steady or increased usage during 2016.
- Only about 25% of usage goes through consortia. While a lot of consortia exist, their nature is changing to become less strictly formed so that members can move among them as needed. Even so, across these several thousand institutions, only 25% of the access came via consortia. Across other measures, like denials, abstract views, and pay-per-view, this proportion holds, with the exception of abstract views, of which 32% came via consortia.
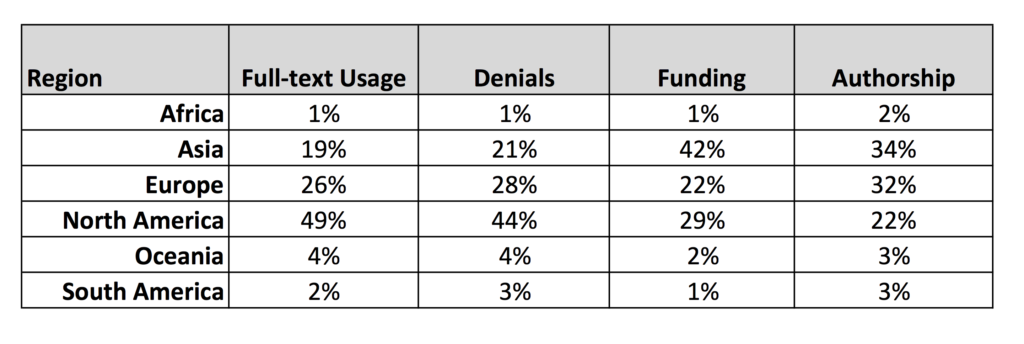
- Most scholarly content is accessed by readers in North America and Europe. Across these 1,500+ journals, 75% of full-text usage came from North America (49%) and Europe (26%). Asia accounted for 19%, putting the full-text usage from these three areas at 94% of the total. An additional 4% came from Oceania (Australia, New Zealand, and Indonesia), with 2% from South America and 1% from Africa. (Rounding makes the total of these stats 101%, I’ll note.) These proportions were fairly similar for denials (turn-aways) and abstract views. North America accounted for 56% of all pay-per-views; however, pay-per-views accounted for 0.01% of all usage across the set, a relatively trivial amount.
- Usage of backfiles is strong and declines with time, while abstracts remain popular. While 65% of the full-text usage recorded in the data occurred around content less than 5 years old, 35% went to the backfile (demarcated as content that is 5 years old or older for this analysis). Taking additional cuts at 10 years and 20 years, full-text usage fell to 21% and 6%, respectively. However, abstract views were higher in all segments. In fact, abstract views of content 5 years old or older represented 58% of all abstract views. At 10 years, abstract views were 40% of the total, and at 20 years or older, abstract views represented 20% of the total.
- Denials (turn-aways) to archival content remain high. Perhaps the most interesting aspect of the dataset comes with the percentage of denials to the backfile, which represented 60% of all denials (turn-aways). Even looking at content 10 years old or older, denials represented 49% of the total, dropping to 37% for content 20 years old or older. Archives and backfiles are still sought after, as these data and the abstract usage combined to illustrate. However, the rate of denials suggests a lack of good service around archival content.
- There is high variability in the number of denials (turn-aways) per 100 article usages. Overall, there were 15 denials (turn-aways) for every 100 full-text usages. However, there was a great deal of variability around this measure at the individual publisher level, with some seeing only a handful of denials for every 100 full-text usages, and some seeing more than 150 denials for every 100 full-text usages.
Denials (turn-aways) occur when a request for content is not fulfilled, usually because access requires a subscription login or credentials of some sort, and the user does not have them. This can be because they aren’t entitled to access (haven’t purchased it), or because they are outside the network of their institution in the case of IP-based access. These can also occur when there have been changes in an institution’s IP addresses that the publisher has not yet incorporated.
The overall trends indicate that demand for subscription journals continues to grow (with 71% of institutional demand holding steady or increasing), both around the current content and archival content (with a high level of denials [turn-aways] around older content). These data also seem to confirm some of the user-service issues raised by the Sci-Hub controversy, which shined a harsh light on how frustrating our paywalls, proxy access, and discovery tools can be for users. The level of denials around archival content may also reflect demand that either publishers or libraries (or both) have not adequately addressed in some manner.
North America accounts for 49% of demand, yet only 29% of funding. This suggests to me more scientists fighting over less funding.
The concentration of the demand market we found in our dataset does not reflect how science is funded. According to the National Science Board’s Science and Engineering Indicators 2016 report, North America accounts for 29% of global R&D expenditures, Europe for 22%, Asia for 42%, and Oceania for 2%, with Africa at 1% and South America at 2%. Drawing lines between funding and demand, you see 51% of the funding in North America and Europe, but 75% of the demand. Adding Asia to the mix brings things into balance — 94% of the demand, 93% of the funding — but this only highlights how much science funding is occurring in Asia, which accounts for 19% of demand in our dataset, yet 42% of global R&D funding. Flipping this, North America accounts for 49% of demand, yet only 29% of funding. This suggests to me more scientists fighting over less funding.
The concentration of demand we identified also does not reflect where science is coming from. The Science and Engineering Indicators 2016 report tallied authorship and partial-authorship for 2013 papers. While the datasets are not temporally identical, these data about authorship are the best and latest available. With the help of the ever-capable Phil Davis and his parsing of the NSF/NSB datasets, we see that 34% of papers originated in Asia, 32% in Europe, 22% in North America, 3% in South America, 3% in Oceania, and 2% in Africa. The usage dataset did not separate out the Middle East, but the NSF/NSB data did, identifying 4% of papers coming from that market. Comparing supply (papers) with demand (usage), we see that North America generated 45% of the demand but only 22% of the papers, while Asia created 19% of the demand but generated 34% of the papers. In economic terms, North America is a buyers market, while Asia is a sellers market. (Note: It’s worth looking at Phil’s earlier post, which also covers the topic of fractional authorship.)
It’s interesting to contemplate which numbers above represent leading or lagging indicators. I’d argue that Asia’s funding level represents a leading indicator, while North America’s demand level represents a lagging indicator, especially if science and subscription funding continue to struggle. The same may be said for Europe, but the differences aren’t as stark.
These usage measures may reflect economic ability as much as anything else, a common critique of subscription publishing. However, the disparities in funding suggest not a difference in financial or economic power, but a difference in priorities. In the US and Europe, subscription support is falling, as is the funding of science as a share of public dollars. In Asia, the funding of science is much more robust.
Language issues may also contribute, as most of the scientific literature is published in English, and most of the usage comes from regions with known facility in English reading, at the least. However, in my experience, this remains a tertiary problem in most regions for our user communities, which often seek out the original English version even if provided with a translation.
Alongside economic ability comes economic burden. With so much usage coming from North America and Europe, these markets may be shouldering the economic burden for most of scientific publishing, meaning that the economic model for subscriptions is somewhat consolidated. Gold OA publishing may consolidate payments for research outputs more around research-producing institutions. If suddenly the world went all Gold OA, and funding of scientific publishing matched either funding share or supply share, Asia would be on the hook for far more of the publishing economy, while North American and Europe would save money. This rebalancing may occur via the subscription model over time, but it’s worth considering the economic effects a radical shift may incur.
Of course, market consolidation is also of interest — that is, we know where the funding and authorship (supply) and usage and denials (demand) are coming from, but what about where the middlemen are? Thanks to Delta Think’s OA Data Analytics Tool (full credits at the end of the post), we have a view into this, for both subscription and OA content. Here are some data from that perspective on the market (“fully OA articles” are, for the sake of this analysis, articles in fully OA journals, thereby excluding articles in hybrid journals). These data are synthesized from various sources, as noted below, and cover 2014-2016:
- Most content overall (56%) was published by European publishers. This holds for fully OA articles as well, 44% of which were published by European publishers.
- North American publishers accounted for 31% of all articles in the market, and 26% of fully OA articles.
- OA in other parts of the world seems to have regional support, with the fully OA article share higher compared to share of the overall market. For example, publishers in Asia accounted for 11% of the overall market, but 15% of the fully OA articles market. South American publishers generated 2% of the articles, but 6% of the fully OA articles.
The consolidation of the market generally continues, favoring publishers in Europe and North America. In this regard, fully OA articles are not changing the status quo among market players much. The trend may be toward the larger publishers, as well, if the successful OA programs from Elsevier, Wiley, SpringerNature, and other North American and European publishers serve as bellwethers. This will be worth watching, especially as the OA market has changed considerably over the past three years.
Ultimately, it appears subscription usage remains strong and is growing overall, with unmet demand remaining around both current and archival content. Leading indicators like funding and authorship are worth watching, as long-term these changes could shift both supply and demand even further. How publishers, librarians, funders, policymakers, and university administrators respond to these imbalances and trends will benefit from collaboration and attention in the years ahead.
(Note about the usage and denials data: A slide deck with charts and interpretations of the usage data mentioned in this post can be requested directly from RedLink. It is provided as a free service to the community.)
(Note about the data for subscription and OA publishers: Source: SCImago, publishers’ websites, and Delta Think Analysis. © 2017 Delta Think, Inc. All rights reserved. May not be reused without permission. SCImago Journal & Country Rank – retrieved November 30, 2016, from http://www.scimagojr.com. You can learn more about Delta Think’s OA Data Analytics Tool at https://deltathink.com/delta-think-investigations-the-evolving-state-of-open-access/.)
(Full disclosure: The author of this post is the CEO of RedLink. Ann Michael, another Scholarly Kitchen blogger, is the President of Delta Think. Phil Davis runs Phil Davis Consulting).

Discussion
10 Thoughts on "Supply, Demand, and the Subscription Model in Scholarly Publishing — An Analysis"
A really interesting analysis, that I would like to share with the participants of the APE 2017 Conference on 17-18 January 2017 in Berlin.
Nice post, Kent. Putting usage data in context is vitally important for understanding trends and overall effect. Last year, as SciHub received so much attention as an alternative source of access to the literature, I was surprised on how so few downloads could be counted from their dump of their data logs. Below, I compare SciHub usage with publisher access and PubMed Central access for a publisher’s stable of journals:
Although no level of illegal downloading is acceptable, Sci-Hub’s use of APS content was very small, representing just 0.6% of total PDF downloads from the journal website, as measured over the same period. In [contrast], there were 9.6 million PDF and 20.0 million full-text (HTML) downloads from the journal websites and 1.5 million HTML downloads from PMC. […] Users from China accounted for more than one-quarter (26.2%) of all APS article requests, followed by Iran (11.5%), Brazil (7.1%), and the U.S. (5.5%)
Sci-Hub is clearly a fringe factor, as more data emerge. Others have found most of the traffic coming from Russia and Iran, and with subscription usage going up generally it seems, the dampening effect of Sci-Hub may be overblown. Anecdotes have a way of appearing much larger than they should in many cases, and a lot of the concern over Sci-Hub has been anecdotal. The actual data seem to show a service that is of marginal utility, once again demonstrating that the plural of “anecdote” is not “data.”
This was a very intriguing observation to me as I’ve been tracking on the effect of “global English” on scholarly communication/library acquisitions/etc.: “this remains a tertiary problem in most regions for our user communities, which often seek out the original English version even if provided with a translation” … Can you by chance point to any data on this find-the-translation-seek-the-English phenomena?
Hi Lisa,
Unfortunately, I can’t point to any data on this, which may in fact be informative in and of itself. My experience is that translations helped readers who read a non-native language about how well I read French — it would give them the gist of the work, but not the nuance. Since science is really greatly influenced by precise wording and nuance, if the report or article piqued their interest, they would want to read the actual report in English to understand exactly what the authors were saying, using the translation as a point of departure. Over time, as well, English is really becoming the lingua franca of science. I’ve seen fewer publishers pursuing translation initiatives, while achieving good market penetration without it. So, my earlier point is that just as it’s difficult to get data on phonograph needle sales these days, it may be hard to get data on the uptake of translations. The market may have shifted away already, except for niche areas.
If anyone else has data or competing experience, please join in.
I’m not sure that it follows that something that is niche is automatically hard to get data about but I will allow that someone has to be interested in gathering, analyzing and disseminating it! I hope someone can enlighten both of us.
I gave a talk on “Global English and/or Local Language: Implications for the Internationalization of Information Literacy” at the European Conference on Information Literacy last year that was the result of exploring the implications of these issues, which of course also meant thinking about causes. I wonder a lot about how easy access to relatively decent on-the-fly translation (e.g., Google Translate) impacts this as well as faculty working in internationalized departments. In an informal poll I did last year, faculty told me that they either asked a colleague to read/interpret a text for them or used an auto-translate service if they came across something in a language other than English. I know I personally rely on Google Translate (and the Chrome plug-in is amazing).
I was surprised to read that 29% of institutions experienced a usage decline. That’s a significant %. Isn’t the total number of readers and articles growing? What could account for usage declines? SciHub, RG, Academia.edu? Or did those institutions cut back on their subscriptions so there was less content available to download? If so, that would indicate that the total size of the industry has declined.
I think declines in usage can occur for a lot of natural reasons — course and reading list changes, journal content that wasn’t as compelling or high-traffic for some reason, or programs with lower enrollment (STEM programs have high attrition rates). Journal cancellations are, of course, another possible reason. However, the “decline” in this analysis represents a decrease of >5%, so if there had been 10,000 full-text views at the beginning of the year and these trended down to be 9,499 per month over the course of the year, that would be a decline, just to illustrate the point. The pirates may contribute to this, but what will be more revealing is over time to identify the natural levels. Is this level of declining usage normal? Is it normal that 71% of institutions had steady or increasing usage? To me, that was more surprising, given all the doom and gloom out there about the subscription model in academic publishing.
Just to clarify, this 29% decline is in number of institutions, correct? So of the 7000 institutions in your study, ~2000 institutions saw a decline in downloads of > 5% year-over-year? IMHO, that is more surprising than 71% saw an steady/increase – the industry itself is reportedly growing in usage and revenues so one would expect increases. The fact that 29% saw a decline suggests that the growth is fragmented, and since those institutions with Big Deals don’t pay more for usage, then it might presage shrinking revenues, while still leaving the question as to why so many institutions are seeing a usage decline. Very interesting data, thanks Kent.
Re: “North America accounts for 49% of demand, yet only 29% of funding. This suggests to me more scientists fighting over less funding.”
I wonder if these figures are based on simple spend in USD, or whether data for different countries was adjusted to reflect each country’s GDP or the buying power of their currency?